Showing posts with label social media analytics. Show all posts

Monday, 28 September 2015

4 Social Media Reports That Will Boost Your Audience Engagement

In the early days of social media marketing, the number one goal for businesses was to amass huge followings, and for good reason. It was a time when there was no limit to organic post reach, and the companies with the largest social audiences benefited the most with totally free advertising.
Unfortunately for those early adopters, the networks have matured, the business models have grown and nowadays brands are lucky if even a fraction of their social following see their posts. That’s why marketers need to completely rethink the way they approach social as an organic channel.
Where before social marketing was all about building a giant audience, today social marketing is about providing quality, relevant content to your audience so that you can engage with them as individuals and attract them as a customer. But in order to really provide your social audience with engaging content, you need to figure out who they are. This can be done with some of the reports available online.
This post will cover how to use data to find your perfect social audience, and how to look at reports on past performance to find out which content resonates with your audience.

1. Demographics Reports

Who are the people that are interacting with you on social media? There’s a chance that you or your community managers can name some of the top influencers within your social following, but who is your average reader? One way to get a tremendous increase in social engagement is to answer this question, and create content that resonates with those individuals. Here are some of the reports available to you that can be used to figure out just who your average social engager is.

Facebook Page Insights

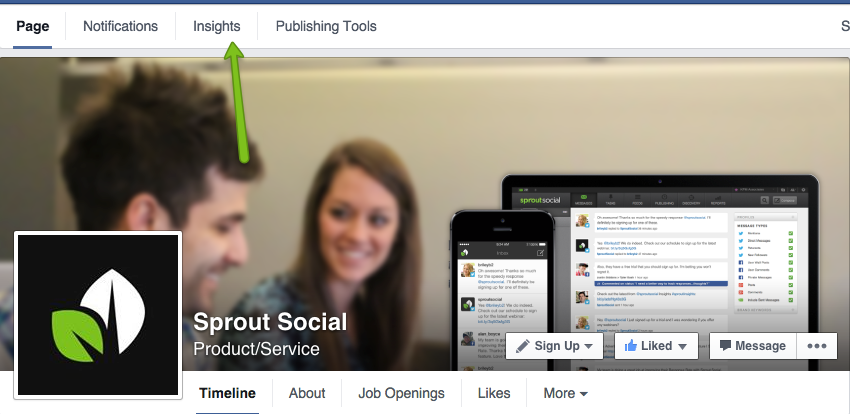
Let’s start with Facebook. Facebook has a plethora of information on your fans and followers. One way to access that information is through the Facebook Insights tab found on your brand’s homepage.
facebook-insights
If this is your first time using this tool, take a look around at some of the great data at hand. Otherwise, navigate over to the People tab to start pulling data on your fans and followers.

facebook-people-tab
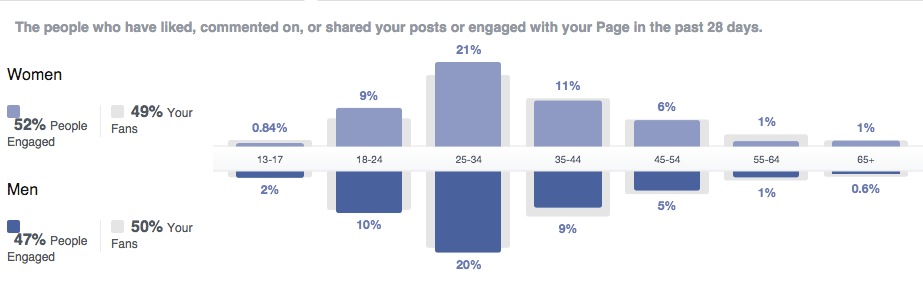
The above screenshot is looking more specifically at the People Engaged section. It’s better to look at People Engaged since this shows the demographics of the people who are more inclined to actually engage with your social posts.
The first data you’ll see breaks down the various ages and genders of the people who are engaging with your Facebook posts. For example, the graph below shows that of all the people interacting with Sprout Social, 21% are women ages 25-34.
people-engaged-facebook
Various age groups and genders are likely to interact with content differently. That’s why it’s a key advantage to figure out your main audience and create posts catered to their interests.

Twitter’s Analytics Tool

Similar to Facebook, Twitter offers audience insights within its analytics dashboard. After you access your analytics page, navigate to the tab addressing your Followers.

twitter-audience-insights-followers
Assuming you have enough followers, this tab has information on their gender, income, education and more, which will help you create content on Twitter that this audience is more likely to interact with. However, the tab doesn’t include age data. One option is to use Sprout’s Twitter Analytics.

Followerwonk

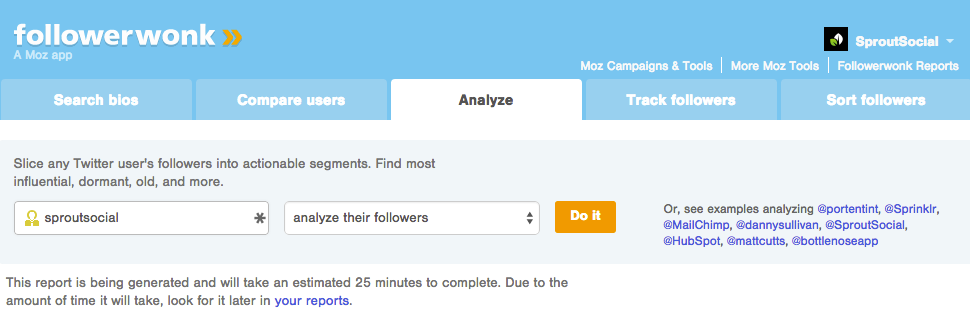
Followerwonk is a Twitter tool created by the software company Moz. If you have access to the tool, choose the Analyze tab from your dashboard.
followerwonk-analyze-their-followers
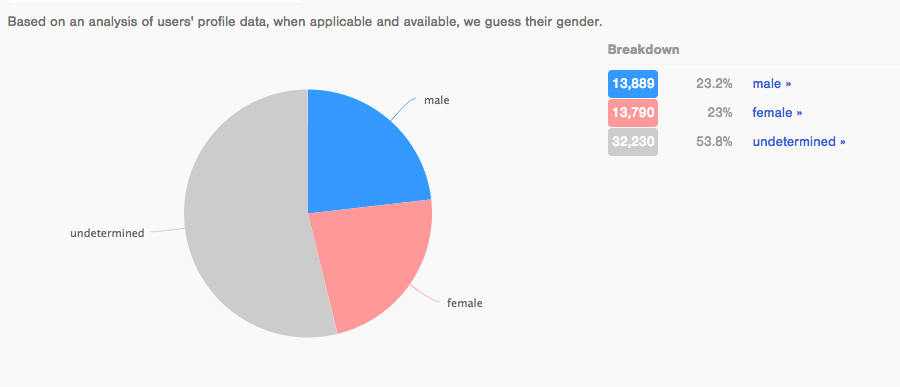
From here you can enter any Twitter handle and scan their followers. The data provided is similar to Twitter’s, but the one we’re most interested in for creating demographic-driven content is the gender section.
followerwonk-analyze-data

Google Analytics

Most of the networks don’t provide as robust data as Facebook and Twitter, but never fear: Google always has your back. Access your account and navigate toAudience > Demographics > Overview.
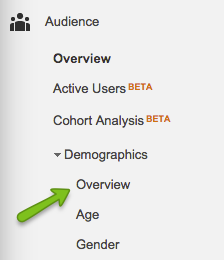
google-analytics-demographics-overview
After that, you need to +Add Segment, that looks at the Traffic Sources you’re interested in finding demographics for, like Pinterest.
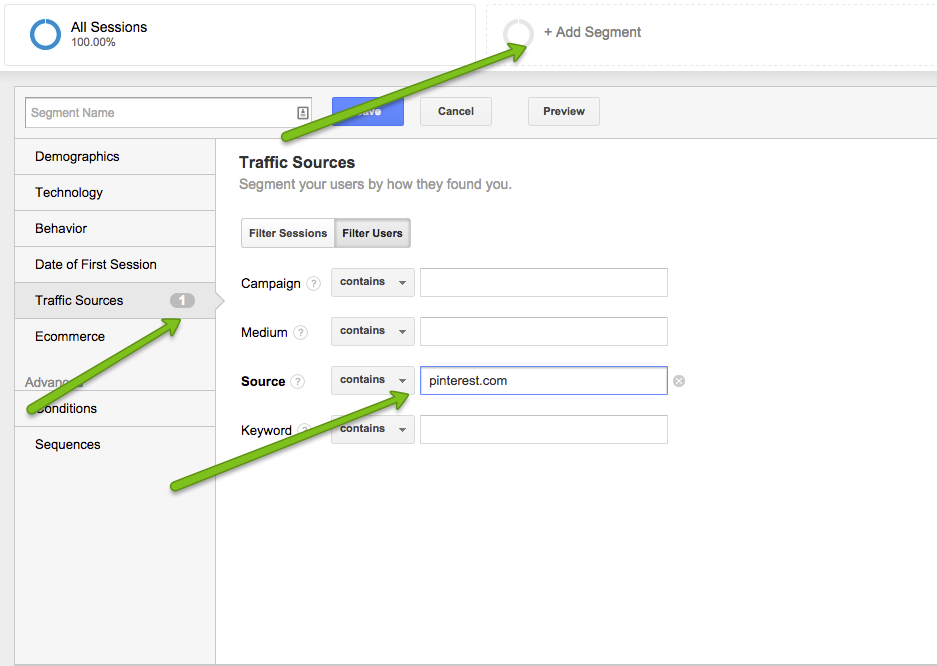
add-segment-traffic-sources-google-analytics

2. Location and Language Reports

Location-based geo–targeting is a very powerful tool for social media marketers. It’s possible for you to pull reports to find some of your most engaged cities, states or countries, and then write and distribute topical content to those locations for better response. For instance, creating a post for a specific city could call out the hometown sports team.

Facebook Page Insights

Back on the Facebook Page Insights report, just a little below the age and gender information, you’ll find data on where the people engaged with your page are located.
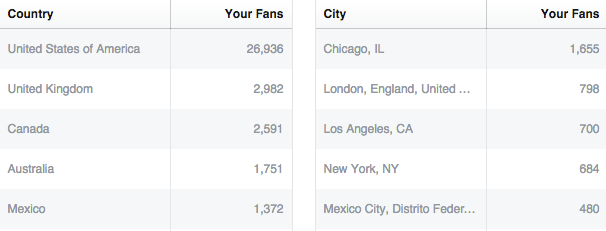
facebook-page-insights-screenshot
So the company in the example above could see some increased engagement if they targeted a post to their Chicago audience that called out The Cubs (or the White Sox if that’s what you’re into…).

Twitter’s Analytics Tool

You’ll find location information when you access your Twitter Analytics the same way as in the previous report, but this time you’ll need to navigate over to the second tab.

twitter-analytics-demographics
In the right column you’ll find information provided by Twitter on both the country and region your followers are in.

Followerwonk

Followerwonk preserves your reports for 60 days, so you should be able to find the same presentation you used when looking at the Demographics report. Followerwonk actually puts your followers’ location data in an interactive map.
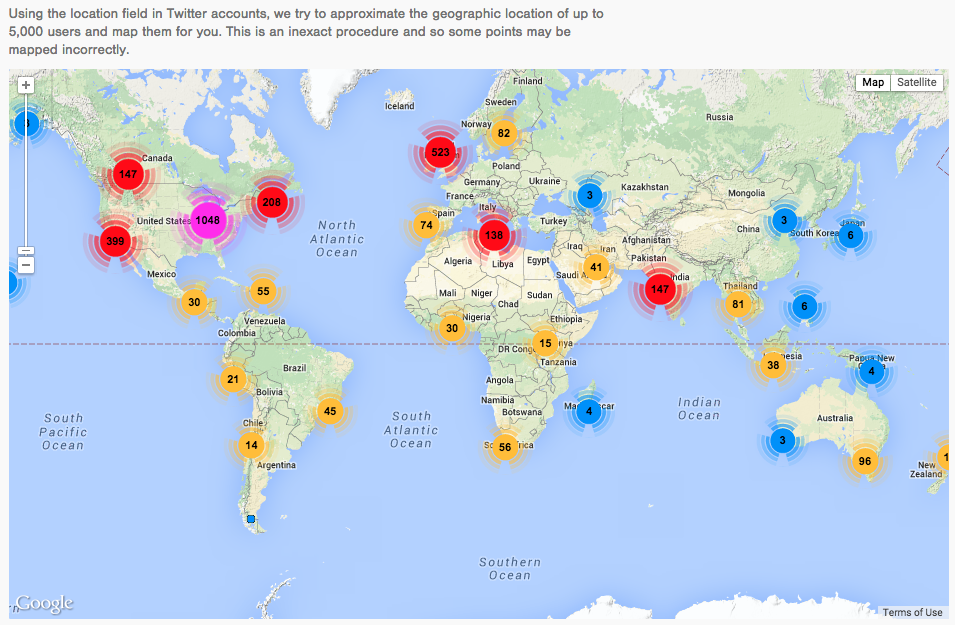
followerwonk-demographics

Google Analytics

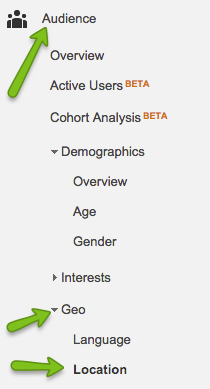
Similar to the Demographics Reports, if you can’t find location data for the other networks look to Google Analytics. Access your account and navigate throughAudience > Geo > Location.
audience-location-google-analytics
After you create the custom segment looking at the social source, Google provides data on users by country, city, continent and subcontinent.

3. Sent Message Reports

Now that we know who our audience is, it’s a good idea to think about the content that they like. One way to do that is to look at your past social media performance to see which of your posts received good engagement, then use that information to dictate your strategy moving forward. A few of the platforms that we’ve mentioned so far have the ability to analyze old posts for performance, but I want to focus on two that do a great job.

Followerwonk

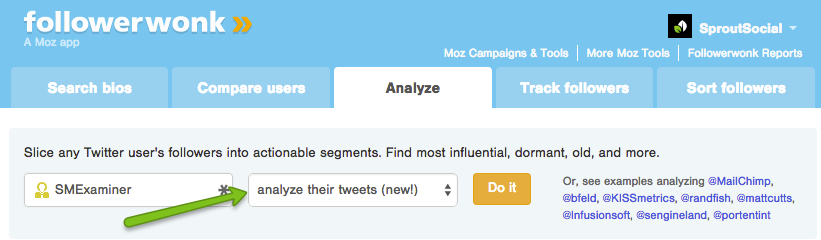
Just like with the other reports, you’ll need to navigate to the Analyze tab of your dashboard. The difference this time is that instead of choosing to “analyze their followers’ you want to choose ‘analyze their tweets’.
followerwonk-analyze-tab
Followerwonk uses Retweets as the main metric for deciding what makes the most important Tweet. In the example above I chose to look at Social Media Examiner. Followerwonk shows that this is their most important Tweet over the time period.

Social Media Examiner can look at this and decide that if they create more fun content that resonates with social media managers, they’ll see more engagement.

Sprout Social

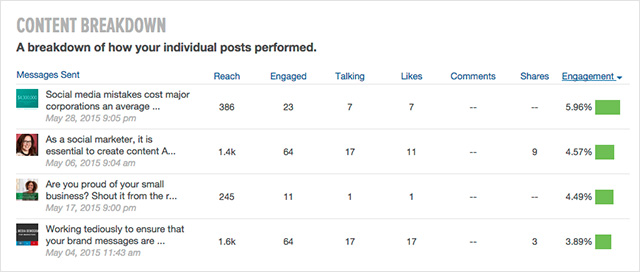
Sprout Social is a social media management platform that also gives you analytics on your past social media performance.
sprout-social-content-breakdown
Sprout has a number of key performance indicators (KPIs) that you can look at to find out which of your pieces of content perform well. You can then study those posts so that they can inform your content strategy moving forward.

4. Day and Hour Reports

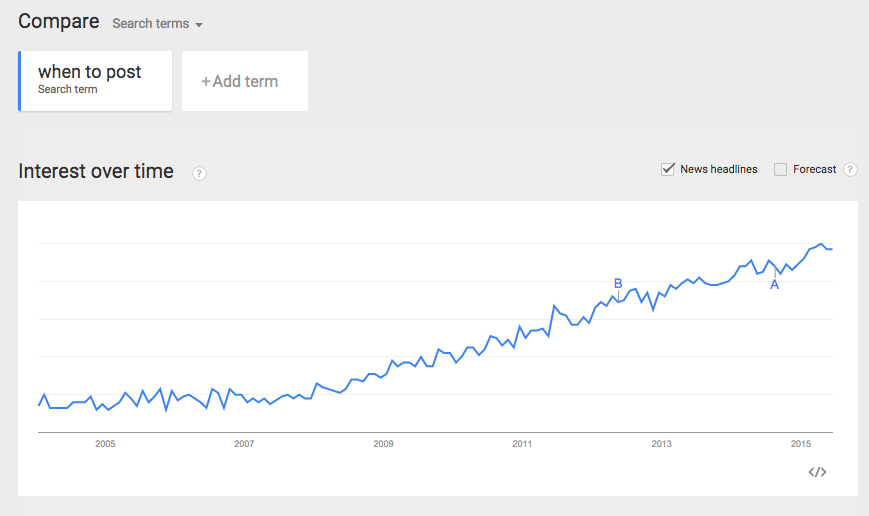
Once you’ve figured out who to target and what to post, the next question on your mind should be “when to post.” And you wouldn’t be the only one, either. This Google Trends graph shows just how fascinated people are with finding the perfect time for posting.
google-trends-when-to-post-search-graph
However, the best time to post for one brand may not be the best time for another. That’s why you should look at these reports to find your unique perfect post time.

Facebook Page Insights

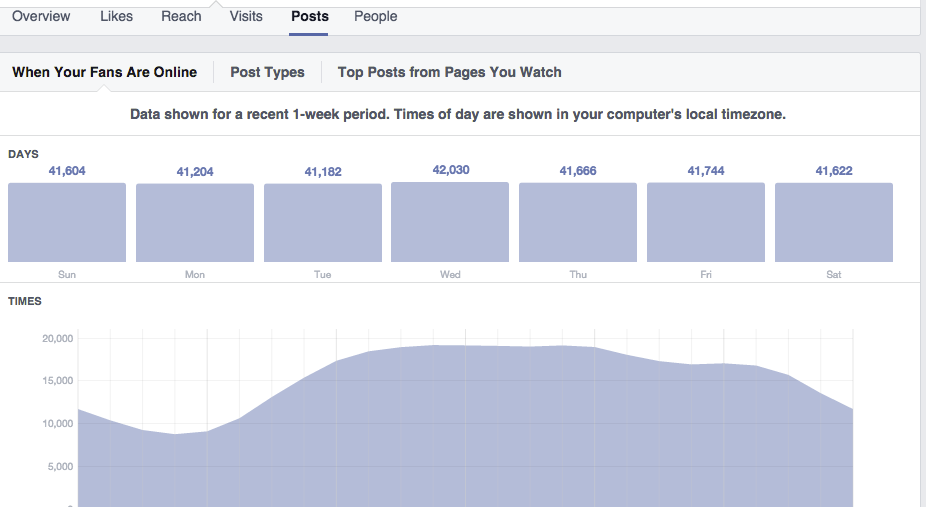
Access your Facebook Page Insights again, and go to the Posts tab. This is where you’ll find additional information on your fans, such as when they’re online.
facebook-page-insights-post
Although this doesn’t say when you get the most engagement, it does have information on the days of the week and hours of the day when your fans are most likely to be online. Posting content at these peak days and hours should lead to an increase in your engagement.

Manual Reporting

Unfortunately, Facebook is one of the only networks out there that provides data on when your users are accessing the site. However, you can always pull data manually to look at which days are performing best. Or try talking to your community manager; most of them have a good idea of which days and times get great response. If all else fails, try a tool like Sprout Social that automatically post your social messages at the time that will yield the most audience engagement.

Every Audience is Unique

No two brands have an identical social media following, so it really doesn’t make much sense to use a one-size-fits-all content strategy. Taking the time to analyze your unique social media audience allows you to develop a content strategy that caters to them, which will set you leagues above the competition.
To view the original article Click Here

Monday, 13 July 2015

How to Easily Analyze the Social Activities of Your Competitors

Do you want to freshen up your social media marketing?
Have you thought about looking at other accounts for inspiration?
Checking out what other companies are doing on social media can help you brainstorm your own content tactics.
In this article you’ll discover how to analyze your competitors’ social accounts to inspire new marketing ideas.
analyze competitors social media activities
Discover how to easily analyze your competitors’ social media activities.

Why Look at the Competition?

Researching your competitors on social media not only provides an overview of your industry, but it also gives you insight into the current habits of the audiences you’re targeting. By answering a few key questions, you’ll see what kinds of posts are effective for the people you want to reach.

#1: Analyze Facebook Pages

If you want to gain insight into a company’s Facebook page, here are some questions to consider:
  • How many followers do they have?
  • What are they posting about?
  • Are their posts mostly internal (company-based) news, blog posts and articles; mostly external news, blog posts and articles; or a mix of both?
  • What’s their brand voice?
  • How often do they post?
  • How many likes/comments/shares do they get per post?
  • Do they run any polls, contests or fun games with their brand?
powell's books facebook page placeit image
Powell’s Books Facebook Page. Image: Placeit.
The Facebook page for Powell’s Books, a famous independent bookstore, is worth checking out as inspiration if you’re a local business hoping to make a national footprint.
One of the first things you’ll notice is that Powell’s takes the time to create their own graphics, which often include quotes from authors. It’s a great twist on a sharable meme for a bookstore.
powell's books facebook post
Powell’s Books creates graphics that incorporate author quotes.
They post photos of customers at individual stores and events, so you can assume their staff participates in social sharing (a great idea for local businesses). They also shareinteractive posts and comment on national conversation topics to keep the feed relevant to non-local fans.
Interestingly, one of the biggest buzz-generators for Powell’s Facebook page is when they share posts on books and publishing from other media, such as The New Yorker. Remember that sometimes social media successes can come from other sources.
Key takeaway: A brick-and-mortar brand can serve both local and national audiences with the right mix of photos and interactive content.

#2: Look at Twitter Accounts

If you’re analyzing a company’s Twitter account, here are some questions to answer to gain insight into their activities:
  • How many followers do they have?
  • How many accounts are they following? A good rule of thumb: An account with 50,000 followers that’s following 500 users probably has more influence than an account with 50,000 followers that’s following 49,000 users, unless they bought followers.
  • What do they tweet about? Are they mostly mirroring their Facebook content, or is their content unique to the channel?
  • Are their posts mostly internal, external or a mix of both?
  • How many favorites/replies/retweets do they average per post? Does one engagement stand out over the others?
  • Have they created lists?
  • What hashtags do they use?
  • Do they run any Twitter chats?
  • Do they use Twitter cards for lead generation, email signups, etc.?
moz twitter placeit image
Moz Twitter account. Image: Placeit.
If you look at the Twitter account for Moz, you’ll notice that they use a photo in almost every Twitter post. Their photos all follow the brand’s style and color scheme, and they’ve created a template for their Twitter images to accompany guest posts.
moz tweet
Moz’s Twitter images follow the brand’s style and color scheme.
Brand-wise, it’s interesting that the “owner” of the Moz account is a robot named Roger. Choosing an on-brand character to run social accounts is a way the Moz brand stands out as playful in the generally more serious SEO industry.
moz twitter owner
A social media character, a robot named Roger, “runs” Moz’s Twitter account.
Key takeaway: Templates and a social media character can help a large brand stay consistent in social, even if multiple people are behind the account.

#3: Examine Instagram Accounts

Answer these questions to evaluate a company’s Instagram account:
  • How many followers do they have?
  • How many accounts are they following?
  • Are their posts mostly internal, external or a mix of both?
  • How on-brand are their photos? Do they show the product or service in each shot, or do they follow a more lifestyle-oriented content strategy?
  • What hashtags do they use?
  • Do they tag other accounts (such as employees or partner companies) in many of their photos?
nikerunning instagram placeit image
Nike Running Instagram account. Image: Placeit.
If you’re selling a product that works as a tool, the Nike Running brand is a great example ofturning a physical object into an emotional campaign, and their Instagram feed reflects this. How do you get people excited about a shoe? You make them feel something about what the shoe can do.
Nike Running’s Instagram feed shows off both the product and its successful users. Recently they posted #thankspaula photos to coincide with the brand’s online and offline campaign to celebrate the career of London Marathon winner Paula Radcliffe.
nike running instagram post
Nike Running celebrated the career of Paula Radcliffe with the hashtag #thankspaula.
They also showcase stories of non-professional runners, accompanied by stunning photography.
nike running instagram post
Nike Running showcases their shoes along with runners who use them.
Even if you can’t hire a world-class photographer, you can learn from the narrative style of Nike Running’s Instagram account. With smartphones that snap high-quality photos, even smaller companies like a local shoe store or a small accessories brand can find ways to use photography to humanize their products.
Key takeaway: Instagram can be about more than showing off the product with fancy filters. It can tell stories worth a thousand words.

#4: Review YouTube Channels

If you’re reviewing a company’s YouTube channel, keep these questions in mind:
  • What’s their video content like, and how on-brand is it? Do they stick to product tutorials, or do they branch out to product non-specific tutorials? Do they show off company parties and happy hours?
  • How many subscribers do they have?
  • How’s their video engagement (for example, the number of comments, tone of comments, number of likes and dislikes per video)?
  • What are the related videos on their watch pages? This should give you a good idea of how the YouTube algorithm categorizes their video metadata.
home depot youtube placeit image
Home Depot YouTube channel. Image: Placeit.
Unless you have an employee with a vlogger-like personality, YouTube can be hard to pull off without a nice video budget. But if you have the resources, or the means to bootstrap them, YouTube is a great social channel for any vertical that intersects with how-to tutorials.
It doesn’t get more DIY than the home improvement space, and Home Depot’s YouTube channel nails it when it comes to how-to video content. One of the first things you’ll notice about the channel is the lack of overt product pushing. You can learn how to install a new toilet or design a patio without feeling like you’re watching an advertisement.
Home Depot organizes their channels like a directory for various around-the-house projects, a useful tactic for any brand with advice to share.
home depot how to youtube videos
Home Depot offers how-to videos on their YouTube channel.
Home Depot also uses their channel to show off their brand’s community-serving mission for improving homes for veterans. If you’re already involved in community service, posting about non-profit projects on YouTube, even in a lower production-value setting, can spread the word about your mission.
Key takeaway: How-to’s don’t have to be on-brand to be effective for YouTube marketing.

#5: Evaluate Pinterest Accounts

If you’re reviewing a company’s Pinterest account, consider these questions:
  • How many followers do they have, and how many users do they follow?
  • How do they show off their product or service in pins?
  • How do they organize their pins? What are their board names?
  • Are their pins all brand-generated (product pins) or do they repin others?
manly pinterest tips placeit image
Manly Pinterest Tips on Pinterest. Image: Placeit.
Want to know if your product has competitors on Pinterest? Just search for your products or services. For example, search for “sportswear,” “seafood” or even “SEO.” That’s how you might find Jeff Sieh’s page. He’s the creative person behind a social media and SEO agency in Texas, and the personality behind a 25,000+ Pinterest following on social media and copywriting tips.
As a man, Jeff is in the minority of frequent Pinterest users, who skew female. But rather than try to blend in, he flaunts his differenceincluding hosting a podcast on Manly Pinterest Tips. And his team creates pin-worthy images for each episode, as shown here.
manly pinterest pins
Jeff Sieh posts creative pins to promote individual podcast episodes.
If you look through his account, you’ll see that Jeff breaks up his boards by medium: Instagram Tips, LinkedIn Tips, etc. And he gives a nod to Pinterest success staples withManly Food and Funny boards, too.
In a medium that focuses on visual collections, Jeff has found a way to flaunt his marketing personality on a few dozen boards.
Key takeaway: If you’re a nontraditional member of an online community, you can use your uniqueness as a marketing advantage.

#6: Monitor Snapchat, Periscope and Meerkat Accounts

Due to the nature of their content, it’s difficult to evaluate these channels in one go. But if your competitors use them, follow their accounts and check out their content when it goes live.
Eventually, the 24-hour time limit on this content may be lifted. For now, you have to stay updated with your competitors’ feeds in real time. Here are some questions to consider:
  • What content are they posting?
  • How many interactions (on Periscope and Meerkat) do they garner from their fans?
Final Thoughts
A thorough competitive analysis takes time to compile, and it may feel like you’re watching the other guy rather than focusing on your own game. But checking out what other companies are doing on social can give you inspiration for your own social content.
Going through a checklist of questions is only the beginning. Putting together a quantifiable measurement method is a great way to dig into other business’s successes, but let yourself wander a bit, too. Explore posts and videos that you find interesting,because those often lead to the best new ideas.
As a bonus to this article, I’ve created a Google Doc template that you can copy and use for your own competitive analyses.
What do you think? How well do competitive analyses work for developing your marketing brand and campaigns? Do you have other items to add to the checklist?List them in the comments!
To view the original article Click Here

Sunday, 28 June 2015

All of the Social Media Metrics That Matter

Did you know that when it comes to social media metrics, there are hundreds that you could be analyzing? But the real question is, do you know where to find them, and are they all necessary for your business. In this post, we’re going to look at the metrics you can gather from the top social networks and which ones matter most for your business.

Official Social Media Metrics

First, let’s look at the metrics you can get directly from the top social networks. Here’s how you find them and what you can learn from them.

Facebook Insights

Facebook offers the most comprehensive metrics for business pages. You can start by going to the Platform Insights page to see a list of all of your Facebook Pages currently tracking metrics.
facebook metrics insights overview screenshot
When you click on the Page you want to analyze, you will be taken to that Page’s insights. Here, you will find an overview of your most important metrics, followed by detailed sections on your Likes, reach, visits, posts, and people.
The overview starts with your Page’s main metrics, including the following.
  • Page Likes: Total Pages Likes is number of unique people who like your Page. New Page Likes shows the number of new Likes your Page received during the last seven days, compared with the previous seven-day period.
  • Post Reach: Total Reach is the number of unique people who have seen any content associated with your Page, including ads, during the last seven days. Post Reach shows the number of unique people who have seen your Page posts.
  • Engagement: People Engaged is the number of unique people who have clicked, Liked, commented on or shared your posts during the last seven days. Likes, Comments, Shares and Post Clicks show the totals for these actions during the last week.
facebook-metrics-engagement-screenshot
Next, you will see an overview of the engagement on the last five posts to your Facebook Page. These metrics include the following.
  • Reach: Post reach is the number of people who have seen your post. Your post counts as reaching someone when it’s shown in News Feed. Figures are for the first 28 days after a post was created and include people viewing your post on desktop and mobile.
  • Engagement: People engaged is the number of unique people who’ve clicked, Liked, commented on or shared your Page posts. In the Overview section of your Page Insights, you can see People Engaged for the last seven days.
facebook metrics recent posts screenshot
At the bottom of the Overview page, you will find metrics for Pages you watch, such as your competitor’s Facebook Pages. Metrics include the Page Likes and engagement for Page posts.
facebook metrics pages to watch screenshot
In the Likes section, you will find your net Likes, which combines the following metrics.
  • Unlikes: Number of people who have unliked your Page.
  • Organic Likes: Number of people who have Liked your Page not as a result of a Facebook Ad campaign.
  • Paid Likes: Number of people who have Liked your Page as a result of a Facebook Ad campaign.
facebook metrics net likes screenshot
Beneath that, you will find a chart showing the source of your Likes. Included are the number of Likes you receive on your Facebook Page itself, from related Page suggestions on other Pages, posts that other people make on your Page and Likes from mobile users.
facebook metrics like sources screenshot
On the Reach tab, you can review two different sets of metrics that affect your reach. After a graph showing your overall organic versus paid reach, you will see a graph showing your overall post Likes, Comments, and Shares. If these metrics increase, you will reach more people organically.
facebook metrics likes comments shares screenshot
Next, you will see how many times people on Facebook hide your post, report posts as spam or unlike your Page. If these metrics increase, you will reach less people organically.
facebook metrics hide posts screenshot
On the Visits tab, you will see metrics for how many people visit specific areas on your Page. These metrics can help you determine if your custom apps are getting traffic and if you need to update specific tabs more often.
On the Posts tab, you will see detailed metrics for your Facebook Page posts. By default, you will start by viewing your post’s organic versus paid reach and the post clicks, Likes, comments and shares. Note that the Post Clicks metric means any click on your Facebook post itself and not just clicks from your post to a website link.
facebook metrics page visits screenshot
facebook metrics published posts screenshot
You can use the first drop-down to switch from seeing your organic versus paid reach to organic versus paid impressions. Note the difference in the reach versus impressions metrics.
  • Impressions: The number of times a post from your Page is displayed, whether the post is clicked or not. People may see multiple impressions of the same post. For example, someone might see a Page update in News Feed once, and then a second time if their friend shares it.
  • Reach: The number of people who received impressions of a Page post. Reach might be less than impressions since one person can see multiple impressions.
facebook metrics organic paid reach screenshot
You can use the second drop-down to switch from seeing post clicks, Likes, comments and shares to seeing only Likes, comments and shares; post hides, spam reports and unlikes; or engagement rate percentage. The latter is defined as follows.
  • Engagement Rate Percentage: Engagement rate is the percentage of people who saw a post that Liked, shared, clicked or commented on it.
facebook metrics post clicks screenshot
On the People tab, you will find a breakdown of demographic metrics for your fans, the people you’ve reached with your Page posts and the people who have engaged with your Page posts. This information can be utilized to ensure that you are getting the right fans for your business and to create content that will appeal to your fans, those you reach and those you engage.
facebook metrics fan insights screenshot
If those aren’t enough metrics for you, you can use the Export button at the top right of your Insights reports to export additional data about your Page, posts and videos uploaded directly to Facebook. These have raw data about your Page’s activity. What is helpful is that each metric is defined within the spreadsheet.
facebook metrics raw data export
Those who upload video will especially love the in-depth video statistics, such as how often a video was viewed for three seconds, 30 seconds or 95% of the total video length.
For those who would prefer a simpler summary of their Facebook Insights, Sprout Social provides one simple report. First, you have the overall Page Likes, impressions and demographics.
sprout social metrics facebook report screenshot
Then you have an overview look at when people are sharing your content and how.
sprout social metrics share data screenshot
Finally, you have a simpler look at how people engage with specific posts on your Facebook Page.
sprout social metrics content breakdown screenshot
This gives you the vital information you need about your Facebook Page in one report, versus in tab after tab.

Twitter Analytics

While not as detailed as Facebook, Twitter offers its own analytics for all account users. When you arrive at your analytics dashboard, you will be greeted by a 28-day summary of metrics and highlights for your activity by month. Included are the following metrics.
  • Tweets: The number of Tweets you’ve posted to your account.
  • Tweet Impressions: The number of people your Tweets have been seen by.
  • Profile Visits: The number of people who have visited your profile.
  • Mentions: The number of times your @username has been mentioned by others.
  • Followers: The number of followers on your Twitter account.
  • Tweets Linking to you: The number of Tweets attributed to you in Twitter Cards with URLs.
twitter metrics overview screenshot
On the Tweets tab, you will see a 28-day summary of metrics for the Tweets you’ve shared. These metrics include the following.
  • Engagement Rate: The number of total link clicks, Retweets, favorites, and replies your Tweets receive divided by the number of impressions.
  • Link Clicks: The number of times links within your Tweets were clicked. This includes links to hashtags and other users mentioned in your Tweets.
  • Retweets: The number of times your Tweets were retweeted by others.
  • Favorites: The number of times your Tweets were favorited by others.
  • Replies: The number of times people replied to your Tweets.
twitter metrics overview 2 screenshot

You can click on any Tweet on this screen to see detailed metrics for the it. Included in these metrics, you will find additional data with an explanation of each.
twitter metrics tweet details screenshot
On the Followers tab, you will get a detailed breakdown of demographics, lifestyle, consumer behavior and mobile information about your followers.
twitter metrics followers screenshot
For those who would prefer a simpler summary of their Twitter analytics, Sprout Social provides one simple report. In a quick glance, you can see your main metrics, follower demographics and publishing statistics.
sprout social media metrics screenshot

Google+ Insights

Google+ does not offer many metrics for its Pages. If you visit your Page’s Dashboard and click on the Manage Your Page button, you will find an overview of your most important metrics plus a link to your Google+ Page Insights.
google plus metrics overview screenshot
Inside, you will find three sections of data. The first is the Visibility section, which shows your total views, broken down by number of pageviews, post views and photo views.
google plus metrics visibility screenshot
In the Engagement section, you will see metrics about the posts to your Google+ page. These include total actions, +1’s, comments and shares. Beneath the detailed metrics for your posts, you will see average actions by post type.
google plus metrics engagement metrics
In the Audience section, you get a quick demographics overview of your Page followers.
google plus metrics audience demographics screenshot

LinkedIn Analytics

When you visit your LinkedIn Company Page you can click on the Analytics tab to learn more about your post performance and audience, all in one page. First, you will see metrics for posts made by your Company Page. These metrics include the following.
  • Impressions: The number of times the update was shown to LinkedIn members.
  • Clicks: The number of clicks on your content, company name or logo.
  • Interactions: The number of likes, comments and shares on your update.
  • Followers: The number of followers you acquired when sponsoring an update.
  • Engagement: The number of interactions divided by number of impressions.
linkedin metrics overview screenshot
Next, you will see information about your followers and how you compare to similar companies.
linkedin metrics follower demographics screenshot
Finally, you will see some metrics for your number of page views, unique visitors and visitor demographics. You can use the drop-down to switch between seniority, industry, company size and function.
linkedin metrics visitors screenshot

Pinterest Analytics

If you have a business account on Pinterest, you can access Pinterest analytics to learn more about your profile activity, audience and Pins. You will start on the Overview screen where you can see key metrics for your profile, audience, activity from your domain and most popular Pins.
pinterest metrics overview screenshot
In the Your Pinterest Profile section, you will see detailed metrics for your profile’s impressions, daily viewers and Pins. You can use the tabs at the top of the report to see top Pins based on number of impressions, Repins, clicks and all-time favorites.
pinterest metrics impressions screenshot
In the Your Audience section, you can see metrics for your average monthly viewers, average monthly engaged and specific demographics and interests.
pinterest metrics demographics screenshot
In the Activity from your domain section, you can see pinning activity from the website you have verified for your page using the Pin It button. You can use the tabs at the top to see top pins from your domain based on impressions, repins, clicks, and all-time favorites.
pinterest metrics domain impressions screenshot

Google Analytics Metrics

Now that you know what kind of metrics you can get out of the top social media networks, let’s discuss the most crucial metrics for your business. Using Google Analytics goals, you can learn more about conversions on your website, such as product sales, lead submissions, and email subscriptions. Combine your goals with the built-in social media reports within Google Analytics, and you can find out which social networks are best for your business.
Under the Acquisition section, you will find a few useful social media reports to help you determine which social networks drive traffic and customers to your website. In the Social Overview, you will get a quick look at the top social networks driving traffic to your website and the total value of the traffic you have received.
google analytics social value screenshot
Under Social Referrals, you will get a more detailed breakdown of the following metrics based on social network referral traffic.
  • Sessions: The periods of time when a user is active on your website.
  • Pageviews: Instances of a page being loaded (or reloaded) in a browser.
  • Avg. Session Duration: The average length of sessions on your website.
  • Pages / Session: The average number of pages viewed per session.
google analytics social referrals screenshot
In the Social Conversions report, you will see which social networks specifically lead to conversions on your website, along with dollar values (assuming you set your Google Analytics goal up with a specific dollar value per conversion).
google analytics social conversions screenshot
These reports can help you determine where to focus your energy when it comes to specific social media networks. More than tracking followers and engagement, they will show you which networks ultimately help your bottom line.
To view the original article Click Here