Showing posts with label google analytics. Show all posts

Sunday, 1 May 2016

3 Ways to Gather Actionable Insights From Google Analytics to Inform Your Marketing Plan

google-analytics-marketing-plan
Today’s marketers are lucky. Why? The amount of data and tools to help interpret that data present an opportunity to be far more effective than in the past. However, marketers may not be using one of the most well-known tools in the most effective way.
We’re talking about Google Analytics. Unfortunately, it can be incredibly easy to merely focus attention on the vanity metrics within the platform. By vanity metrics, I mean sessions, users, pageviews, and other metrics that sound important. Of course it sounds great to have one millions sessions, but that metric doesn’t provide me with any actionable data. In fact, vanity metrics don’t provide much, if any, value.
Instead, marketers need to focus on the actionable metrics that will help improve and optimize performance. After all, Google Analytics should be viewed as an optimization tool. Marketers can use Google Analytics to create actionable plans to optimize a website. Actionable metrics help marketers create plans to improve a website in terms of creating new content, updating a site structure, or many other aspects of a website.
Below we’ll cover three ways that marketers can use Google Analytics to gather valuable insights and create an actionable plan based on those insights.

#1 – Find Your Best Performing Pages by Conversions

One of the first actionable reports you should analyze is page performance in terms of number of conversions. You can run the report for any channel to identify the best converting pages by source to get better insights. Being the SEO Analyst I am, I tend to focus on organic traffic. A report I recommend running is one that analyzes individual page performance during a certain date range compared monthly or yearly for organic sessions.
Analyzing the individual page performance in with the organic segment enabled can give insight if your site is increasing in authority for all pages or just a couple pages on a website. Once I have the report in the correct date range and filtered by the organic segment, I can see what pages are contributing to conversions. By comparing the date ranges, you can generally see changes in which you should identify any negatively performing pages.
After analyzing what pages are contributing to a loss of conversions an action plan should be created to fix the issues that may be causing the decrease. If it is only one page that is contributing to a large loss of conversions then a quick assessment can be made at the page level. If most pages are decreasing in performance then you might have some more technical SEO issues.
GA 1
Pro Tip: Add annotations to Google Analytics for algorithm updates to match up any increases or decreases from organic performance quickly. A sudden change in organic sessions may be related to an algorithm change, among other situations too.

#2 – Mobile is Different Than Desktop

Making your website mobile friendly has been a topic covered in great detail by many blogs. With how important mobile is now, marketers should be looking at mobile data to make actionable steps to optimize the experience for their audience.
Instead of looking at how many users are coming to a website via mobile, we should look how mobile users interact with the site. A great report to run is one that uncovers the engagement metrics of the mobile users. There are a lot of engagement metrics to focus on like time on page and average pages per visit, but I like to keep it simple with the bounce rate on mobile devices.
Once again, you can view the number of conversions via mobile as that is always a good metric to track. Viewing the mobile bounce rate by itself doesn’t provide too much context. Of course, you can view the mobile pages that contain the highest bounce rate and analyze each page to see what you should do to lower the bounce rate. Or, you can compare the mobile bounce rate with the desktop bounce rate of a particular page. This comparison will help you understand how different the mobile experience may be for users and what needs to do done to make the experience better for either the mobile or desktop version.
Mobile is too important to just look at the number of sessions. Instead, focus on the metrics within the mobile data to build a tailored experience that your users are looking for. Just because your website is responsive doesn’t mean you shouldn’t focus on the data. You could be missing a large opportunity by not looking closer into the mobile data.
GA 2
Pro Tip: Use the mobile page performance as a means of getting buy-in to test different types of content for mobile users. Showing the difference between mobile data and desktop will help create ideas on how to frame and show content to each user.  

#3 – Get Your Own Site Search Data

One often overlooked report in Google Analytics is the site search report under Behavior section. To access this report, you will need to setup the functionality first. Once setup, Google Analytics will track the search terms that people use on a website’s internal search tool. The site search report is awesome, because it will show you exactly how many times the site search tool was used, what terms people search for, and the page they search on. All three metrics within the site search report are important, but I tend to focus on the search terms report.
The search terms report will provide a list of keywords that people used on your website. There are many ways you can utilize this information, but one way is to create additional content on the most searched terms. Adding more content based off of what people are searching for will provide your audience with the content they want. Besides creating more amazing content for your audience, you may discover that people aren’t finding the right page easily enough. Instead, people might be searching for a particular page that would benefit them if included in the navigational structure.
GA 3
Pro Tip: Use the site terms report to help structure a website for your audience. It may make sense to add or remove pages from a navigational menu if there are commonalities to the search terms.

Bringing it all together

As we discovered in this post, there are multiple other ways to track actionable metrics within Google Analytics. As a marketer, it makes me happy that I can develop a strategy to improve a website with the help of analytical data. At the same time, we have to be careful not to get caught up in only focusing on the vanity metrics as the main KPIs.
Understanding analytics can be hard and it takes a skilled marketer to use the data to make informed decisions. The good news is that TopRank Marketing can help you understand your data more and make the informed decisions to optimize the experience for your target audience. Do you need help with setting up and understanding analytics?
Header image via Shutterstock
To view the original article Click Here

Sunday, 13 March 2016

6 Google Analytics Metrics You Should Be Using For CRO


There are numerous places to start when first analyzing a landing page or website. One of those places is Google Analytics. Analytics allows you to pull useful reports that provide a further analysis of current performance and where to optimize to improve that performance. Today, we’ll focus on six analytics metrics that will contribute to your conversion rate optimizations.

1. Bounce Rate 

The first metric to evaluate on the landing page or website is the bounce rate. The overall bounce rate of the site can tell us how long users are staying on the site before leaving. We can break it down by specific pages to measure bounce rate on each page. Below is an example of how we can measure bounce rates and what they mean for the site.
This is just one way to break down bounce rate metrics. We can take away a few key learnings from this data. The product page is an important page on an ecommerce site. The product page is the visitor’s step before adding their specific product to the cart and potentially purchasing. We want to provide enough information for the visitor so they’re able to proceed without leaving.

2. Time On Site

The second metric to pay attention to is the average session duration. This metric gives us an indication of how long our visitors are actually staying on the site and tells us a story. For example, there could be navigational issues if they’re spending too much time on the site. While spending too much time on the site isn’t necessarily a problem, in combination with other user testing findings, the session duration could contribute to a larger story.
Screen Shot 2016-02-14 at 9.03.33 PM
In the example above, we’re able to look at session duration by the type of audience visiting the site. In this example, for our paid search clients, we want to increase the session duration and meet their expectations after visiting the site.

3. Pages Per Visit 

The third metric to analyze is the number of pages per visit. This metric could be easily analyzed in combination with the bounce rate and the average session duration. If the session duration is longer, the user might visit more pages. If the bounce rate is high, the pages per session could be low. We want to make sure that our visitors are navigating the site and finding what they’re looking for. We want to increase our conversion rates and if users aren’t visiting enough pages to either fill out our form or purchase a product, we want to improve the experience.
Screen Shot 2016-02-14 at 9.03.55 PM

4. New vs. Returning 

The next metric we’ll look into is analyzing our audience types. Breaking the audience down by new vs. returning visitors, we’re able to take a closer look into how audience types impact performance. Below is an example of how we can break down our metrics.
Screen Shot 2015-10-28 at 10.46.45 AM
From this data, we can make a few assumptions in our efforts to improve performance. Because a lot of the sessions above are new visitors, we want to optimize performance for this particular audience. Are we not providing enough information on the page in that their bounce rate is higher and their session duration is lower?
For our returning visitors, is there a way we can increase the session duration even more and drop the bounce rate?. Since these visitors are returning, they might already have more brand recognition and wouldn’t need to bounce.

5. Devices 

The next report looks at performance by device. Below is a chart combining the above metrics but further broken down by the device used.
Screen Shot 2015-10-28 at 10.46.38 AM
Our key finding is to focus on mobile users. In this specific example, mobile sessions are a lot higher than the other two devices and the metrics are much worse in comparison. Because we have so many mobile users, we can definitely use these metrics to help form a CRO strategy and testing structure. From this device report, mobile would be one of our first recommendations to begin testing to improve the metrics

6. In-Page Analytics

The last Google Analytics tool is In-Page analytics. This tool is an add-on you can use on your pages to measure activity on the page you’re focusing. If you don’t have heatmapping technologies set up on your site, this is a tool to utilize to see where visitors are clicking and what links they’re clicking. We can use this data to see what elements are most important to the visitor and try to optimize around that information.

Final Thoughts

The amount of information within Google Analytics is massive. These 6 metrics are just the beginning of the type of information we can use to further our CRO strategies and techniques. I encourage you if you haven’t used Analytics data in the past, to dive into the reports and the various metrics to develop an analysis to increase conversion rate and optimize the user experience.
To view the original article Click Here

Tuesday, 8 March 2016

Why Facebook And Google Analytics Conversions Don’t Add Up

Why Facebook and Google Analytics conversions don't add up


This question has come up a lot lately with PPC accounts that are expanding into Facebook Ads. “Why are my Facebook conversions higher than Google Analytics?” The problem is we are trying to compare Facebook conversions similar to how we track AdWords and Bing traffic, but it’s not the same.
When it comes to comparing conversions, it’s not that Facebook is necessarily over reporting or Google Analytics is under-reporting, they just are different. Below I will break down how Facebook and Google Analytics report conversions and tips for how to close the gap.

Why Conversions Don’t Add Up

When comparing conversion tracking across various platforms or 3rd party reporting systems, it’s fairly typical for conversions to be off by at least 10-15%. This is due to a number of factors including de-duping logic, where the pixels are implemented on the site, and a host of other issues. A few other reasons that prevent Facebook and Google Analytics from matching up include:

  • Cross-Device – Majority of Facebook interaction is on mobile which is difficult for Google Analytics to track across devices and browsers
  • Different attribution models
  • Facebook counts multiple conversions vs. unique (1-click)
In addition, many 3rd party-tracking providers like Google Analytics use referrer URLs to credit conversions back to ads. Due to this method, these providers generally under-report Facebook conversions by about 40%. This is due to the fact that roughly 40% of Facebook users browse Facebook using HTTPS instead of HTTP. So when a user clicks a Facebook ad and converts on site, the referrer cannot be recorded since the user left an HTTPS environment and entered an HTTP environment. The other piece in why they don’t match up comes down to attribution and the default reporting setting for Google Analytics and Facebook.

How Facebook Reports Conversions

Facebook tends to be more generous with conversion tracking compared to Google Analytics when comparing the default models. Facebook default conversion tracking is as follows:

  • 24 hour view through
  • 28 day click through
Any comparison you do against other conversion reporting data should be within the same attribution model.

Facebook conversion reporting tips to keep in mind:

  • Conversions are attributed to either a view through conversion or click through – never both
  • Clicks take precedence over views
  • Conversions are attributed to the most recent ad someone clicked or viewed.
  • Any events outside the maximum conversion window (28 days) are not counted.
The Facebook conversion tracking process looks something like this:
Clicked ad from Facebook > Left site > Converted on website 3 days later

How Google Analytics Reports Conversions


Google Analytics only reports conversions that resulted from a direct referral. Even if you created a campaign using URL parameters to track the link used in your ad, Google only reports those conversions that happened in a straight line:
Clicked Ad > Converted
As I mentioned above, by default, Facebook counts view through conversions that happened within the first 24 hours where Google Analytics only tracks last non-direct clicked conversions.

How To Close The Conversion Gap

Facebook

While it’s likely Google Analytics and Facebook will never match up 100%, below are a few tips for trying to close the gap.
  • Customize Facebook attribution window
 Attribution window
Updating the attribution window so that it more closely aligns with Google Analytics can help close the gap. For example, you can remove 24-hour view through conversions. You can customize the attribution window by going to:
Select Campaign > Columns > Customize Columns > Bottom Right Attribution Settings
CustomizeColumns

Google Analytics 

Review the Multi-Channel Funnels > Top Conversion Path reports to get a sense of how Facebook is actually supporting the funnel. Typically you will see that Facebook falls higher in the funnel – generally higher first click attribution.
GA-Multi-Channel Funnel

From here you could use this information to potentially create a customattribution model for Facebook. For example, you could test potentially a Position Based model which attributes 40% to the first and last touch points or look at creating your own custom attribution model.

Compare Conversion To Offline Data

If you have access to offline conversion data, understanding what percentage difference there is between offline data and the various platforms will also help you have a better understanding when it comes to optimizations. If you regularly track what percentage conversions in Facebook and Google Analytics are off by compared to offline data as the benchmark, this can also help to determine if there could be a potential tracking issue over time, helping you optimize and budget accordingly.

Closing Thoughts 

Tracking is always a tough maze to navigate. If you don’t take the time to understand how each platform tracks and reports, you could be trying to compare apples and oranges. Understanding the attribution, timing and then customizing reporting to better align the platforms, can help close the gap and help you start comparing different types of apples vs. oranges.
To view the original article Click Here

Friday, 19 February 2016

Fixing 404 Error Pages with Google Analytics

How to fix 404 error pages with google analytics


There have been multiple blog posts written over the years on how to use Google Analytics to identify and fix 404 Error Pages.
I have even written one myself and it’s a common slide in many of my talks. But with the newest features that are available within Google Analytics, these blog posts are due an update.

Custom Variables vs Events

The first question is whether to capture details of the 404 Error Page within page level customisations or as an event.
My approach is to capture more information about the page using page level customisation. Since viewing a 404 Error Page is not an event, it should not be treated as one.

Google Analytics tracking

Step one in the GA tracking for Error Pages is to rename the page name to /error-page/404-error. This means all views of this page are grouped together, making them easier to identify and analysis becomes significantly easier.
There are two key pieces of information to capture on each 404 Error Page. The first is the URL of the page and the second is the referrer to the page.
Both are available as default Variables within GTM (Google Tag Manager) and so no developer support is required to capture them. The L3 Analytics approach is to capture the Page URL as a Content Grouping and the Referrer as either a Content Grouping or a Hit scoped Custom Dimension.
enabled built in variables
Previously I would have stopped at that tracking, but an Error Page view should now also be captured as a Custom Metric. It will provide an easy way to see the total number of Error Page views for the website or broken down by any session/user dimension.

Google Analytics configuration

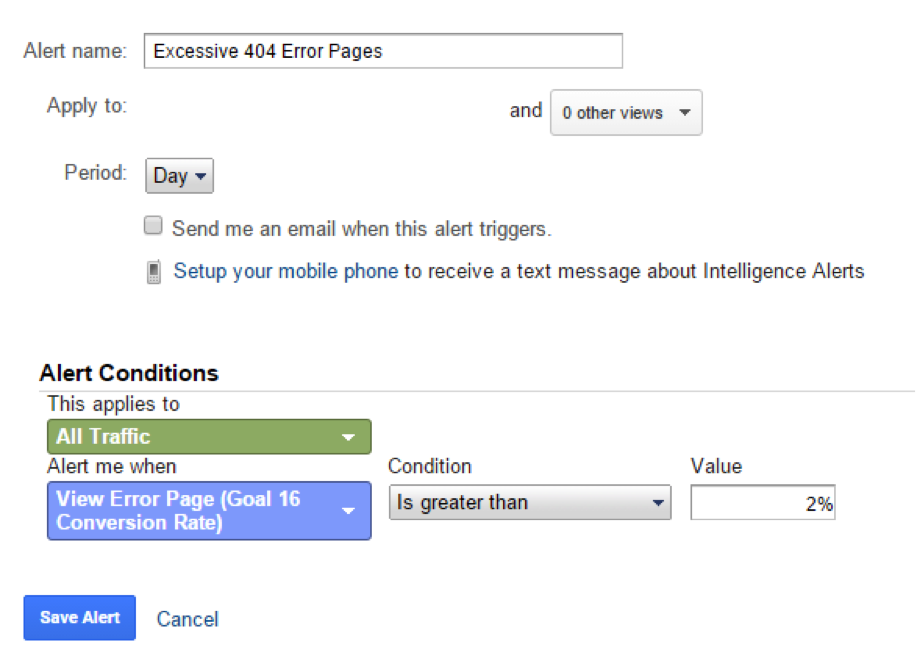
Previously, we always recommended creating a Goal for View Error Page. It is useful to know if visitors are seeing 404 Error Pages and if this metric ever exceeds a certain value (e.g. 2%) for this to trigger an immediate action.
This should be set up as a Custom Alert within Google Analytics to notify you when visitors are experiencing an excessive number of 404 Error Pages.
excessive error pages
To investigate the cause of 404 Error Pages, a Custom Report is required. It’s fairly simple, the report is filtered to only include data from 404 Error Pages and the dimensions are the Page URL and the Referrer.
The metrics in this example are Pageviews and Unique Pageviews (basically error counts) although you can now use the Custom Metric of Error Page Views.
There are two tabs within this Custom Report with the dimensions simply reversed in the second tab. When the report is run, it displays URLs which trigger the 404 Error Page, allowing you to click through to see the referrer to this page.
edit custom report
Switching to the second tab flips these two dimensions, displaying the referrers that trigger 404 Errors and allowing you to click through to view the URLs of the error pages. While this doesn’t solve everything, it allows you to identify the source of 404 Error Pages and where they are sending traffic to in error.
You could search the page source for these URLs or it might be obvious from their structure why there is a problem.

To view the original article Click Here

Wednesday, 27 January 2016

How to Use Google Analytics For Social Media Measurement

The importance social media marketing plays in long-term business growth is one of the most heavily debated topics among marketers and business owners.
Most social marketers would agree that tying social media marketing to actual business results is a very difficult task. Social media marketing, in comparison to traditional media and alternate forms of digital marketing, is still in its infancy. As the tools marketers use become more sophisticated, and our strategies more refined, the role social media marketing plays in impacting business growth will become easier to quantify.
In the meantime, measuring how social media is turning into actual business results is not impossible. In fact, one of the greatest tools at measuring and reporting social media success is freely available and probably already installed on your website: Google Analytics!
Landing Page Comparison
And don’t forget to check out Simply Measured’s Landing Page Comparison, which gathers data from Google Analytics so you can easily understand how your landing pages compare in terms of goal completions and bounce rate.
In this post, we’ll cover basic Google Analytics reports, set up goal conversions, look at how to review conversions from social media, and pull all of the most important reports into a single downloadable social media marketing dashboard.

Identify and Set Up Goal Conversions

The first step in measuring the success of a business’s social media strategy is determining what within the website needs to be measured. Common goal conversions include form completions, downloads, time on site, amount of pages viewed, or even a specific sequence of pages viewed.
To set up a goal within Google Analytics, click your Admin tab, select your view, and click Goals > + New Goal.
new-goal
For this example, let’s create a goal to measure the number of email newsletter opt-ins from the website. The Goal setup step has a few templates, but I usually recommend the Custom selection.
Goal description is simply the name this conversion will appear as in reports. Leave Goal slot ID as is and select Destination for the Type.
Under the Goal details field enter the URL of the thank you or completion page, excluding the domain name. Optionally, if you know the lifetime value of one email subscriber, enter it in the Value field. You can even specify a sequence of pages required before a conversion is counted (for example, a multi-page form). You can enter this information in the Funnelfield.
goal-setup
Save your goal and it will immediately begin measuring all future traffic to the conversion page entered in the Goal details field. Later on, we’ll look at how to determine what kind of impact social media is having on website conversions.

Identify Which Platform Drives the Most Traffic

To accurately measure how social media is influencing overall website traffic, you must be able to view traffic referred by social media networks independent of all other traffic sources.
This information is in the Channels report, which can be found by clickingAcquisition > All Traffic > Channels.
channel-grouping-report
The Channels report silos all individual traffic sources into their corresponding groups and allows businesses to easily compare traffic from each channel type. This is important because businesses can review not only total site visits per channel, but also engagement and conversion rates channel-to-channel, which helps determine the quality and value of the traffic referred by each channel.
Simply Measured's Social Traffic Report gets right to the heart of the matter, synthesizing Google Analytics data and making it easy to understand and manipulate -- and visually appealing.
Simply Measured’s Social Traffic Report gets right to the heart of the matter, synthesizing Google Analytics data and making it easy to understand and manipulate, and also visually appealing.
Using the date selection, this report can be compared month-over-month, year-over-year (or any other time frame) to show changes in traffic, engagement, and conversions over time.
Clicking on the Social channel dives deeper into this report, revealing all individual referring networks.
social-channel-report
This is the same as the Channels report, only now you’re reviewing traffic, engagement, and conversions on a network-to-network level. This can be useful if you’re wondering exactly how a specific network’s strategy is paying off in terms of goal conversions and on-site engagement.

View Conversions Assisted By Social Media

There are a lot of ways to review the number of conversions from social media, the easiest being the Social view of the Channels report mentioned above.
social-conversions-report
What I feel is more important is measuring the amount of conversions that social media has assisted with but has not been awarded the attribution. One often-misunderstood piece of conversion reporting is that in most cases, the conversion is attributed to the traffic source directly before the conversion. This is called Last Click Attribution.
For example, what happens if a consumer discovers the brand by visiting the site through a tweet, comes back three days later through a remarketing ad, and becomes a customer? Pay-per-click is awarded the attribution, even though social media is how the customer discovered the business.
To see how many conversions social media has assisted in, open theAssisted Conversions report by clicking Conversions > Multi-Channel Funnels > Assisted Conversions.
assisted-conversions-report
In this report you can see Social was attributed with 903 conversions in a Last Click Attribution model. However, Social assisted in 173 more conversions which have been attributed elsewhere.
Clicking the First Interaction Analysis tab at the top of the Assisted Conversions report shows us that Social would be attributed with 941 conversions in a First Click Attribution model.
first-click-attribution
Whatever the case may be, a combination of these reports is a great way to show exactly what role social media marketing is playing in the ever-changing consumer purchase path, be it introducing future customers to the business or directly selling a product.

Create a Social Media Marketing Dashboard

Sometimes, proving the value of social media marketing is all about how the data is presented. There’s no easier way to do this than to set up a social media marketing dashboard within Google Analytics.
To get started creating a new dashboard, click Dashboard > New Dashboard. Select Blank Canvas, name your dashboard, and select Create Dashboard.
social-media-dashboard
The first widget I always create is Total Social Visits. To do this, I selectMetric as the Standard and Sessions as the Metric.
The most important piece of every widget in this dashboard is filtering out any non-social media traffic. This is done by adding a filter which matches,Only show + Default Channel Grouping + Containing + Social.
total-social-site-visits
From here, you can keep adding widgets to track what is most important to the business. Just remember to filter out any non-social media traffic. Some of my favorite widgets include Conversions by Network, Time on Site by Network, Pages Per Session by Network, and New Visitor Acquisition by Network.
If you need a little more guidance in creating a social media dashboard, you can click here to automatically import my dashboard and learn from the widgets I’ve created.

Measurement Starts With Organization & Understanding

Measuring and reporting on how successful your social media marketing efforts are at driving web traffic is not impossible; in fact, it’s relatively easy with just a few basic reports. It all begins with having a well-planned and organized strategy with clearly defined goals.
The more clear it is to everyone in your business exactly what the social media goals are and how you will measure them, the easier it becomes to show the value of social media marketing. If you need more help clarifying the role of social in your own organization, download Simply Measured’s on-point guide below.
To view the original article Click Here