Showing posts with label a beginners guide. Show all posts

Monday, 4 January 2016

A Beginner’s Guide To Social Media Marketing From The 10,000 Small Businesses Program

Bloomua / Shutterstock.com
Bloomua / Shutterstock.com
In July, I had the privilege of serving as a social media panelist for the New Orleans cohort of Goldman Sachs’ 10,000 Small Businesses program. Along with two other online marketing professionals from the area, I was to host an interactive session with the business owners and entrepreneurs about leveraging social media for their businesses.
The 10,000 Small Businesses program is a Goldman Sachs and Goldman Sachs Foundation investment to create jobs and economic opportunities across the country. The program provides entrepreneurs with better access to support services, education and capital via 20 locations and 100 partners in the US. Angie Scott, COO of Search Influence (my employer), is an alumna of the program.
This is the 11th cohort of the program here in New Orleans, and the scholars were about halfway through their program at the time of the social media panel. As a young professional, sitting down with this room full of folks who’ve built businesses and successful ventures was quite the experience!
The questions we fielded ranged from beginner-level (How do I know what platforms my business should be on?) to more advanced (Do posts on Instagram get more engagement when shared from a personal or company profile?). It really demonstrated for me the wide range of social media knowledge out there among business owners.
Below, I’ve provided a sampling of the questions we were asked and the advice I think is vital for growing businesses to heed.

Tips On Implementing Social Media Marketing For Your Business

Q: How should companies use online marketing? What are the main tactical aspects to consider when using online marketing?
“Online marketing” is a broad term that encompasses search engine optimization, social media management, display and retargeting advertising, content marketing and more.
Those are common words we throw around inside the industry, but to some business owners it sounds like gibberish. In reality, all of those things total up to online public relations, reputation building and management.
It’s all about getting people in the online community to see your business as a trusted provider of goods or services and making information about your business easily accessible online.
Speaking broadly, whatever your budget or time investment available for online marketing is, you should employ a few key tactics to be successful:
• Create a consistent brand message. Make sure everything about your business information — from the way you write your business name to your graphics to the phone number you list for customers to contact you — is consistent everywhere you’re present online. This builds trust with search engines and with users.
Exceptions would include utilizing call-tracking numbers to measure your success in certain media, but be careful about hard-coding call-tracking numbers on your site and social media platforms.
• Maintain a constant presence. The feeds are going by quickly, so if you don’t remain present, you won’t be remembered.
– 4.75 billion pieces of content are shared daily on Facebook as of May 2013, which is a 94-percent increase from August 2012. (Source:Facebook)
– Social media is a vehicle for delivering and consuming content. Be sure that your content strategy is not only constant but also effective in reaching your audience.
• You have to pay to play. Remember, the social media networks are businesses, too, and they need to make money just like the rest of us. They employ algorithms to ensure their advertisers get the most traction, while businesses using social media organically (non-paid) have more work to do in order to be seen.
• Engage with your audience. Social media and online platforms shouldn’t be read-only media. Businesses should be present so they can hear first-hand what consumers are saying about them or their products, but they also need to engage those customers.
When done well, social and online marketing can turn good customers into brand ambassadors.
• Leverage user-provided information to learn about your audience and target customers. When considering using social media for a small business, I recommend the first step should be sitting down and defining your target audience.
There’s no point in using social media for marketing your business if you don’t know who you’re trying to connect with and what will resonate with them.
The beautiful thing about social media is the rich information users provide (both knowingly and unknowingly) about themselves, which can give marketers insight into how to connect with them best.
• Most importantly, have fun.
Q: Is social media marketing imperative for businesses?
Many businesses historically succeeded without a need for social media or heavy advertising. Today, the number of companies that will be able to sustain success without online marketing is declining at the speed with which the online landscape is changing.
Basic word-of-mouth marketing may suffice for some businesses. My best friend’s father runs a local plumbing company, and he’s never touched social media, yet he continues to stay in business. Those essential home services-style businesses will always have the word-of-mouth referral factor.
For Generation Y (also often referred to as Millennials), social media equals word of mouth. Social media is where they consume news, entertainment, information about products, trends and businesses, and of course, the opinions of their friends and acquaintances.
According to Pew Research, in 2014, half of all adult Facebook users had more than 200 friends on the site. While younger users tend to have the largest friend networks, those users won’t stay young forever and someday will become a prospective customer for you or your competitor.
In short, social media is imperative for businesses that want to grow, scale and sustain themselves in the economy of tomorrow. If the general public is going to be talking about you anyway, wouldn’t it be better to be there, engaging and capitalizing, than ignoring it?
Q: How should a business use social media in comparison with traditional advertising, shows, events and more?
In comparison to traditional advertising, social media can be a DIY platform. With a bit of a time investment, you can even be successful on social media without much of a budget, though I wouldn’t recommend it without some practice, professional advice and constant learning.
Social media platforms like Facebook hold billions of pieces of data about their users’ likes, dislikes, location, friends, family, purchases, reviews and much more. Users and consumers of social media provide information by filling out their profiles and simply engaging with others on the platforms.
The fact that marketers and advertisers can leverage such rich data is what sets social media and online marketing apart from traditional types of advertising.
In addition, the detailed analytics and insights into user behavior and interaction with the businessare unmatched when compared with those from traditional media like television or billboards.
Q: Can you give some examples of what worked and did not work in your business or for your clients?
While I’m sure everyone on the panel could talk about this for hours, in short, what works best for our customers is to have a wholesome presence on whichever social media outlets are right for them and their audience. We consider a wholesome approach to include four main tactics:
  1. Creative and consistent content strategy
  2. Consistent and interesting visual branding
  3. Ad spend to grow your reach and visibility
  4. Engagement with the audience (replying to comments, answering questions, sharing follower stories and photos)
What doesn’t work:
  • Letting a teenager who claims to be a “social media expert” run the show
  • Blindly targeting “everyone” using social media (not knowing your audience)
  • Lacking SMART (specific, measurable, achievable, relevant and timely) goals
  • Failing to take advantage of social media tools for scheduling content and measuring success
Q: What time and financial resources should be dedicated to social media each month?
Resource allocation to social media truly depends on the business’s goals, the intended audience and the type of industry or product they are promoting. We have clients who are successful on social media that spend a few hundred dollars per month and big regional brands that are selling tickets online and spending thousands per month.
This is where consulting with an expert is crucial, as they can advise you on the appropriate budget to allocate to these efforts based on a little research and projection.
Q: What final words of wisdom do you have for businesses looking into social media?
Test things for yourself! There is a lot of information and research out there about the best time of day to post, the perfect type of content, how to get the most engagement, and the list goes on.
We’ve seen success using those data, and we’ve also seen success when we go rogue. Only through trial and error can you determine the most effective way for your business to utilize social media for marketing. You won’t know if you never try!
To view the original article Click Here

Friday, 7 August 2015

49 email marketing tips for beginners

It’s strange to think that email is still such an important tool for marketers, and in fact business people of all types, when there is so much technology at our fingertips now. 
I’m pretty sure the only people who communicate via email outside of the commercial world are my parents, but for marketers around the world this platform is still going strong. 
After writing a list about social media tips for beginners last week and thoroughly educating myself in the process, I thought I’d do the same for email marketing this time. 
I’m going to focus on five key areas:
  • Getting started
  • Content
  • Subject line
  • Sending
  • Managing subscribers 

Getting started

Define your audience. Make sure you understand who you are sending emails to and what type of content they are likely to be receptive to. 
Split your email list into targeted segments so you can deliver content to a more specific audience. This is likely to be more effective than blanket-emailing everyone on your contacts list. 
Always get permission from people before adding them to your email list. Preferably use a double opt-in system. 
Read up on how to avoid spam filters. Your email marketing client should have some specific advice on this. Refer to it every time you send an email. 
Spam
Invite people to sign up to your email list. There are tons of ways to do this, but one approach is to ask people during the checkout process. You could use a popup, but be careful not to annoy people. 
Offer people something in return for signing up. Why should anyone care what you’ve got to say? There has to be something in it for them, such as exclusive content or offers. Or at least the promise of genuinely useful information.
Promote your email newsletter on social media by asking followers to sign up. 
Don’t buy email lists from some dodgy data company. If you want to get in front of a specific audience you’re better off asking to be included in an already established newsletter in your industry. 

Content

Tailor your content to a specific audience for the best chance of engagement. Segmenting your email list helps with this. 
Make it personal. This doesn’t mean you have to tailor your email to every individual recipient, but try to write it as if you were only sending it to one person.
Be human. People are more likely to care about what you’re saying if you use everyday language. If you talk like a soulless corporate robot they’re likely to switch off very quickly.
Terminator
Play to people’s emotions. If you can invoke an emotional reaction in people they are far more likely to engage with your content. 
At the very least, offer genuinely useful or timely information. 
Always include a call to action. Of course you want people to enjoy reading your email, but don’t forget the end game: you want them to do something as a result.
Avoid long blocks of uninterrupted text. Refer to our guide on blog page formatting for more info on how to write for an online audience.
Use imagery. This breaks up the email nicely and makes it more visually appealing. 
But remember images are turned off by default on many email platforms, so make sure all your key messages are included in text format. 
Make it easy for readers to scan the content by using plenty of subheadings and white space.
Don’t use people’s names too often. A bit of personalisation is fine, but if you overdo it it’s just a little bit creepy. 
Make sure your emails are properly branded. Or ‘on brand’ if you want to use marketing speak. Again this may seem obvious, but you want your emails to fit with the rest of your content and be immediately recognisable as coming from your business. 
Include contact details in case people want to get in touch after having their minds blown by your email. 
Include links, and double-check them. Seems like an obvious one, but that doesn’t make it any less important.
Put links in your images as well as your text. 
Link to your social media accounts. If people enjoy your email content they may well be interested in what you’ve got to say elsewhere. 
Make sure the content is mobile-friendly. This is becoming increasingly important as many people (myself included) prefer to read emails on their phone. 
Ask for feedback, particularly if you’re just starting out or it’s a new campaign. It can be a great way to fine-tune your email marketing efforts based on what your customers actually want. 

Subject line

Think carefully about your wording. Always ask yourself: ‘would I open that?’ Or better yet: ‘who cares?’ (until the question no longer applies). 
Keep it short and punchy. Clarity is the aim here. In as few words as possible.
STOP CAPITALISING EVERYTHING. Why would you want to shout at your lovely customers?
Caps lock
Don’t use people’s names in the subject line. This is more of a personal gripe I suppose, but I find it a massive turn-off when brands do this. 
If you serve localised customers, personalise your subject line to the recipient’s town or city.For companies like Groupon, for example, this works really well. 
Make each subject line unique. Even if you send the same newsletter template out every week, make sure the subject line applies to the content within that specific email. 
Offer people something. Hard selling may turn people off but there’s nothing wrong with the promise of a genuinely good deal. Test out a few different offers to see what works. 
There are certain words you should never use. 45 of them are listed here
Use urgency, i.e. limited stock or availability, or a ‘today-only’ deal.  
Asking questions can be effective. But previous email subject line tests have produced mixed results for this approach. Do your own testing to see which questions work. 
Make sure your subject line is relevant to your content. If it’s nothing but click bait, people might be reluctant to open it next time.
Experiment. Test. Repeat. The only way you’re really going to know what works is by testing different subject lines and seeing what gets the most opens. Split testing is a good way to go about this. 
Don’t forget the ‘from’ line. This should clearly identify who you are as the sender so people know where the email is coming from.

Sending

Proofread every email before it goes out. This should preferably be done by someone who wasn’t involved in writing it. 
Proofread
Always send a test email first to make sure everything is working as it should be, and to catch any mistakes you might have missed. 
Send regular emails. We send out a ‘Daily Pulse’ newsletter, for example, with links to our latest blog posts. But depending on your audience you might want to update people weekly or monthly.
Be consistent. If you are going to have a weekly newsletter then make sure it really does go out every week. If people are waiting for it it’s not going to look good when it doesn’t show up.
Don’t overdo it on the frequency. How often you send an email out will depend on the audience and type of content. Just make sure people don’t feel bombarded. 
Timing is everything. Do some research to see when your audience is most receptive to emails and do your own tests to see which days and times get the best engagement. 

Managing your subscribers

Send a welcome email to every new subscriber. Thank them. It’s polite, but it also means there’s no discrepancy as to whether they’ve signed up or not.
Welcome message
Use your welcome message to tell subscribers what to expect from future emails. 
Clean your email list regularly. Check for anything returned as undeliverable or any incorrect or non-existent email addresses, and remove them.
Make it easy to unsubscribe. Unless you want to end up on a black list faster than you can say ‘spam’ and generally annoy people to the point they’ll never buy from you again.

What have I missed?

That’s a fairly big list to get you started, but no doubt I’ve missed something important. 
Let me know in the comments below if you’ve got any email marketing tips for beginners that I haven’t mentioned above.
To view the original article Click Here

Tuesday, 28 October 2014

A beginner’s guide to Google Analytics

These are some of the things that Google Analytics (GA) can show you and, once you have that information, you can use it to make your site even better.
So, if you have a blog or a website but aren’t yet using Google’s web analytics software to keep track of your traffic and visitors, it’s time to get with the programme!
If you’re already using it or have tried using but find it overwhelming and hard to understand, this guide will walk you through everything you need to know about GA and how you can use the data it provides to your advantage.
Whether this is your first time using GA or not, we’re going to start from the very beginning, from how to set it up on your website to how to extract numbers that drive action and help you improve your site.

What is Google Analytics?

Why should you use it?

How to set it up

Getting to know the Dashboard

Finding valuable information and using it to improve your site


1. Audience – Who are my visitors?
2. Acquisition: How are people finding my site?
3. Behaviour – What content do my visitors like most?
4. Conversions – How much is my site converting?
5. Creating custom reports

Wrapping up

What is Google Analytics?


Google Analytics is one of the most powerful web analytics software out there and it’s free which makes it even more appealing. No wonder more than 10 million websites are using it.
GA gathers analytics information from your website so you can monitor the number of visitors your site receives, where they came from, how they navigate through your site as well as other interesting stats.
While there are many tools available that can help you get this information, since Google is the largest search engine on the internet and since most of your site’s traffic probably comes from Google, it’s an effective tool to track website traffic and get insights on your visitors’ behaviour on your site.

Why should you use it?


Because you’ll get free access to so much awesome information about your website and your visitors, including:
  • How many people have visited your site
  • Which countries they live in
  • How they landed on your site (from Twitter, from a search engine, from an article they read on a blog)
  • How much time they spent on your site and if they visited other pages as well
  • What technology they used to access your site (desktop, tablet, smartphone)
  • Which are your most popular web pages and/or blog posts
  • Which sites or blogs are sending traffic your way
  • Which social network is sending you the most amount of visitors
This may sound like a lot of information but don’t worry. Once you go through this guide and see how all this information is organised and where you can find what you’re looking for, it will no longer seem that complicated.

How to set it up


If you already have GA installed on your site, go ahead and jump to the next section.
For GA to be able to track your visitors and website traffic it needs to gather information from your site whenever a visitor lands on one of your pages. And it can only do that if you have GA installed on your site so let’s do that now.
Go to Google Analytics and create an account, if you don’t have one already. If you do, simply sign in to your account.
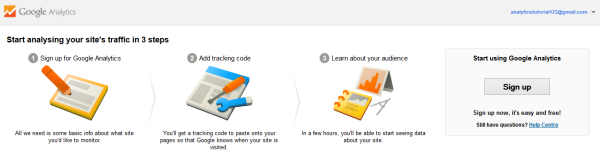
Next, click the Access Google Analytics button and then click on Sign Up:
Set up Google Analytics
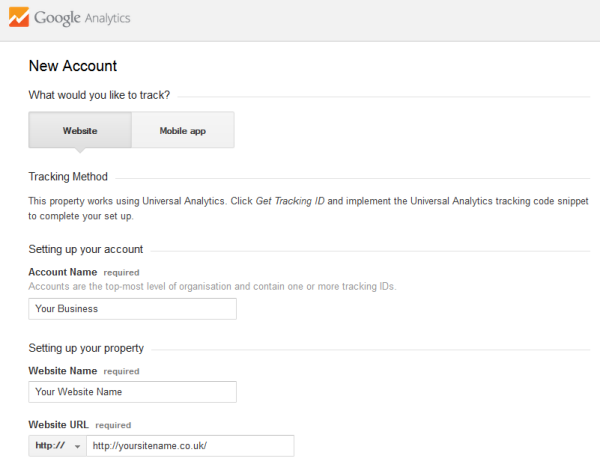
On the next page, you will need to fill in some basic information about your site like website name and URL, time zone and more:
Google Analytics New Account
Now click on the Get Tracking ID button.
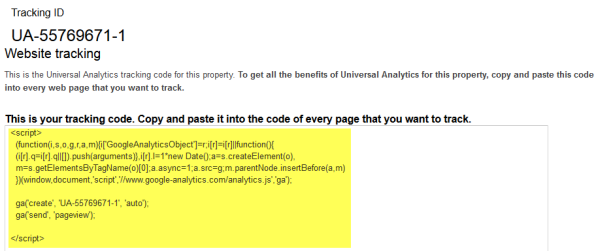
What’s that? Well, GA will only track pages on your site that contain the GA tracking code. This is a small Javascript snippet that you’ll need to add to each page of your site so it can track it.
Here’s how the tracking code looks:
Google Analytics Tracking Code
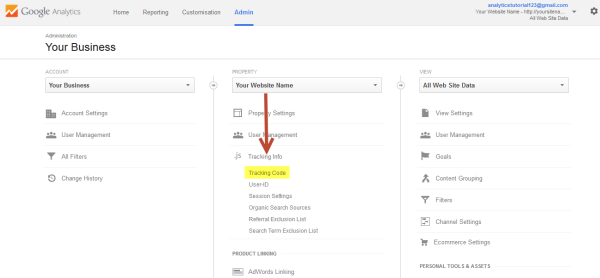
If you accidentally lose or delete it, you can access it anytime by following these steps:
  • Go to Admin and then choose the profile for which you would like to retrieve the tracking code.
  • Click on Tracking Info and then on Tracking ID from the dropdown menu.
Google Analytics Access Tracking Code
To insert the Google Analytics code, you need to have access to your site’s source code. If you’ve hired someone to manage your site for you, you’ll need to provide them access to your admin or FTP so they can access your HTML code.
If you want to do it yourself, log in to your content management system (CMS) and access your site’s HTML code. Now you need to copy and paste the tracking code inside the header file, between <head> and </head>. Be sure to place it on a line of its own and not in the middle of other code. Since the header file is common for all page, it will added automatically to all the pages on your site.
If you have a WordPress site, implementing the code is a breeze. Log in to your WordPress Admin and then click Appearance -> Editor. Open your theme’s header.php file and paste the tracking code between <head> and </head> then click “Update File”. Or you could use a plugin like Google Analytics by Yoastwhere you would only need to copy and paste the tracking code and the plugin will then add it to all current and new pages for you.
It may take up to 24 hours for Google to gather all the data. If after 24 hours you can’t see any data, verify that you’ve properly set up GA by revisiting the Tracking Code section. You’ll see a section titled Tracking Status Information at the top of the page. You want the status to read Tracking Installed, which tells you that the code is working and the data is being pulling into Google Analytics accurately.
If the status reads Waiting for Data, Google Analytics has found the tracking code but is still working to gather the data into reports. If the status is Tracking Not Installed or Not Verified, follow Google’s recommendations to troubleshoot the problem.
Now that you have GA installed properly you’re finally ready to get started using it to analyse your web traffic!

Getting to know the Dashboard

Analytics Dashboard
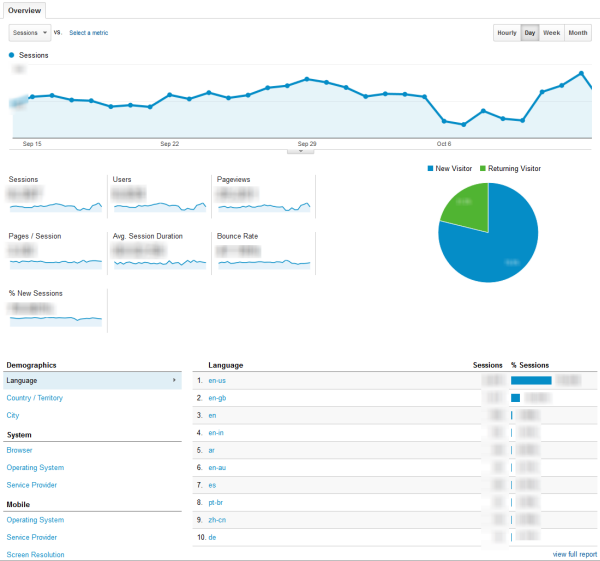
The Audience overview is the default screen you’ll see when you access GA and it includes graphs, percentages and pie charts on:
  • How many people have visited your site in the last month
  • How many of them are first-time visitors and how many have returned to your site
  • How many pages were viewed along with the average number of pages per visit
  • How long the average visitor stayed on your page
  • Your site’s bounce rate meaning how many people left a page they landed on without viewing another page.
You’ll also see some demographics, system, and mobile reports at the bottom of the overview screen.
  • Demographics – Click on Language, Country/ Territory and City to find out which country and city your visitors live in as well as the languages they speak.
  • System – When you click on the three options under System, you’ll get more details on which browsers, operating systems and service providers your visitors use.
  • Mobile – This is where you can see how many of your visitors are using mobile devices to access your site and which ones.

Finding valuable information and using it to improve your site

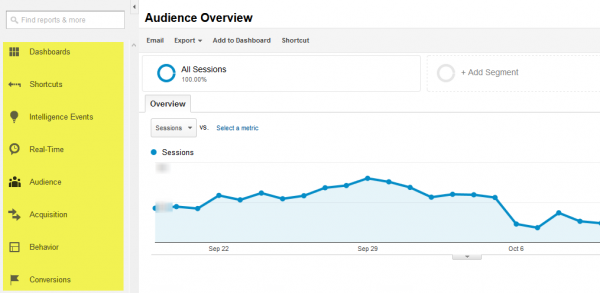
This is where all the fun begins. On the left side of the page you’ll see a menu with several sections and each section includes valuable information about your site’s visitors, content, performance and how well it’s converting.
Analytics Menu
I’ll walk you through each section and explain how you can use that information to your advantage. Once you’re done reading this guide, you’ll know exactly where to go if you want to find out where your visitors are coming from or what’s the most popular post that sent you the most amount of traffic from Twitter.
Let’s get started.

1. Audience – Who are my visitors?

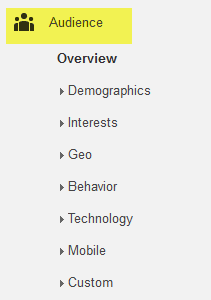
This is where you need to go when you want to find out more about your visitors:
Google Analytics Audience
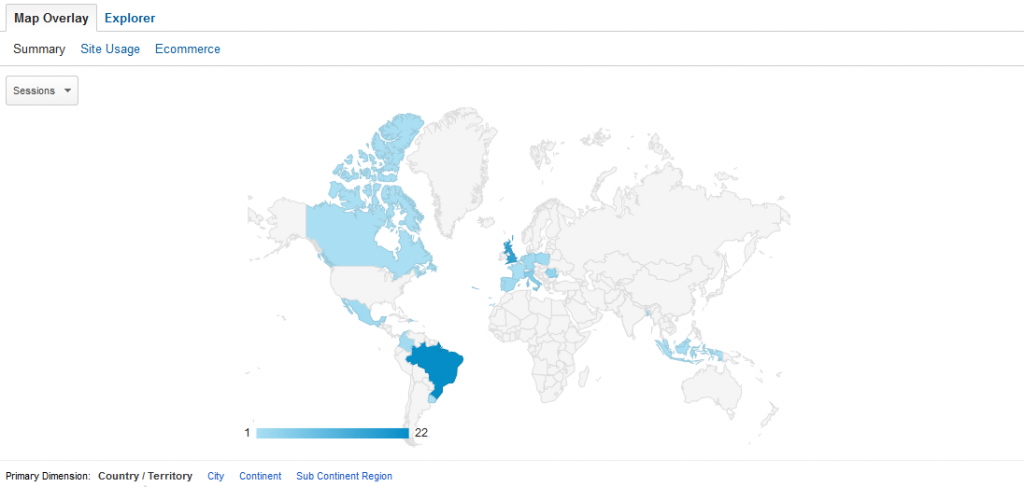
The Audience section gives you information on your visitor’s age and gender (under Demographics), the languages they speak and their location, including a map overlay which you can click on for more detailed information about where your visitors are coming from (under Geo).
Google Analytics Map Overlay
To dig deeper, you could use metrics and secondary dimensions to find out even more information.
  • Dimensions are the rows you see in GA that allow you to sort or filter data so you can get the exact information you’re looking for and use it to improve your site . For example, language is a dimension and so is browser preference and you can sort your data in GA to show you which languages your visitors speak or which browsers they’re using to access your site.You can find all those things as the titles of rows in GA reports.
  • Metrics are the numbers that usually populate those rows. So you might have a Country report where you have rows with the countries your visitors are coming from, but it also gives you metrics: how many visits per country, how much time they spend on site depending on country, what’s the bounce rate per country, and more.
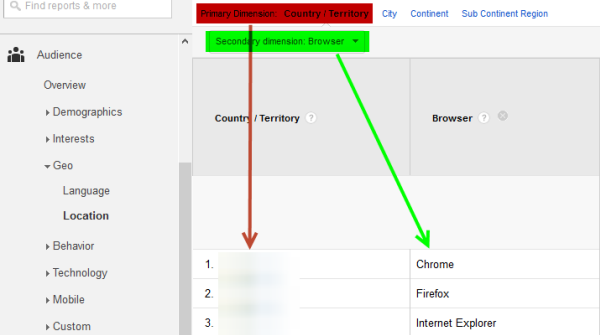
Let’s take a very simple example and see the browsers and operating systems people use depending on the country they live in. To do that, go to Geo -> Location and then choose Browser as a secondary dimension:
Google Analytics metrics dimensions
The next sub-report in the Audience section is Behaviour which gives you more information on how many new visitors you have and how many are frequently returning to your site, as well as how much time they spend on your site.
This section is very important so let’s take them one by one:
  • New vs Returning shows you how many users are visiting your site for the first time and how many of them return. While it’s great to have loads of new visitors, it’s also very important to keep them coming back to your site. So if both these percentage are high (50-50, 60-40), kudos to you!
  • Frequency & Recency tellyouhow often your returning visitors are coming back to your site. You can also view the Days since last visit report which shows you how many days have passed since the last time your return visitors have been on your site.
  • Engagement shows you two metrics: Session Duration (how much time a visitor has spent on your site) and Page Depth (or how many pages a visitor viewed). You want a high number of visitors that are viewing more than one page, and are spending more than a few seconds on your site. The more time they spend and the more pages they visit, the more interested they are in what you have to say or offer.
Two other very useful reports in the Audience section are for technology and mobile statistics.
  • The Technology tab tells you which browsers and operating systems your visitors are using to access your site.
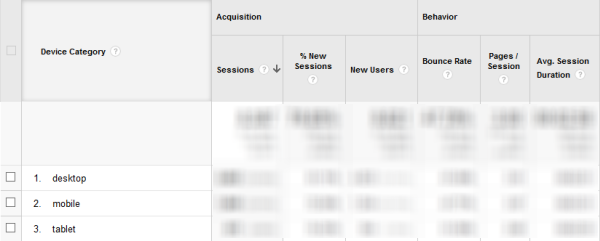
  • The Mobile tab tells you how many people are accessing your site using a mobile or tablet device. Plus, you’ll even get to see which specific mobile devices they’re using.
Here’s how the Mobile Overview looks:
Google Analytics Mobile
Why is this useful? Well, think about it: if you discover that a high percentage of your visitors are using their smartphones to visit your site (like in the above screenshot, for example), this is a clear sign that you need to create a mobile-friendly version of your site to ensure your site is displayed properly on desktop and mobile as well.
What’s more, if you’re considering developing a mobile application for your site, looking at this data you’ll know if you should focus on one that’s compatible with iOS, Android or Windows Phone.
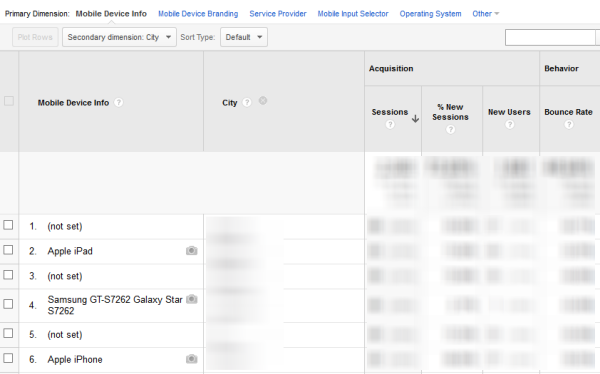
You can go even further. Select Mobile -> Devices and as a secondary dimension select City:
Google Analytics Mobile City
This will show you which mobile devices users from specific cities use. So if I develop an app, I’ll know to make it compatible with iOS and Android.
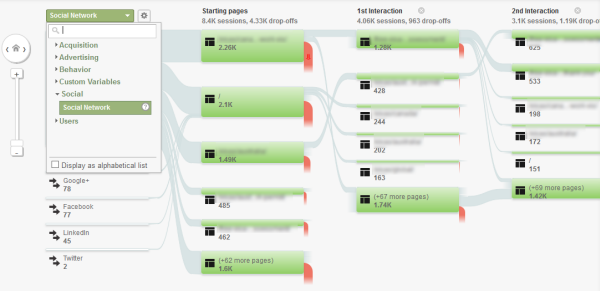
The last report is for Users Flow which features a cool flow chart that shows you exactly how visitors navigate through your site: where they came from, which page they landed on and which page they were on when they left the site.
From the top drop down menu you can choose different starting points. For example, maybe you want to see the complete journey of visitors coming from social networks. Choose Social -> Social Network from the drop down menu and visualise their journey through your site.
Google Analytics Social Network

2. Acquisition: How are people finding my site?


This section is one of the most important in GA. That’s because it shows you exactly where your traffic is coming from which helps you determine if your search engine optimisation efforts are paying off.
Google Analytics Acquisition
Your traffic should come from various channels (paid search, direct, social, etc), and not from a single source. Why? Imagine most of your organic traffic comes from Google and they release an algorithm update that drops your rankings from the first page, down to the 20th page. That would be a disaster! People wouldn’t be able to find you via Google and visitor numbers would fall sharply.
However, if only 30-40% of your traffic comes from Google, in the event of an update that negatively impacts your rankings, your site will survive as you’ll still get some traffic from other sources. This will somewhat compensate for a huge drop in traffic coming from Google’s search engine results pages.
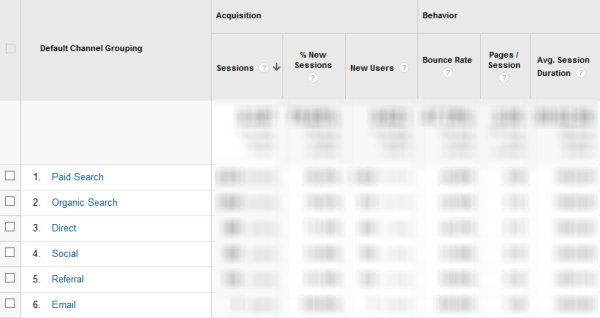
To see exactly which blogs, websites, directories, search engines and social networks are sending you the most traffic, you’ll want to take a look at each of the sections under “Acquisition”, including:
  • All Traffic which tells you how someone discovered your site. It includes everything from users typing your domain name into their browser to clicking on a search result to clicking from another website.
  • All Referrals is a bit more specific as it only includes visits from people who landed on your site after clicking on a link from another website. So this section doesn’t include search traffic and direct visitors but it’s a great way to check traffic coming from external sites where you might have published a guest post.
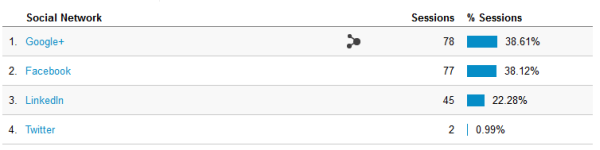
  • Social provides some insightful information about your social media efforts. You will not only get to see which social networks are sending you (the most) traffic but also which pages were most popular on each social network.
For example, if you go to Social -> Overview you’ll see which social networks are sending you traffic:
Google Analytics Social overview
If you click on any of them, say Facebook, you’ll see the top pages on your site that people visited from Facebook. This is useful as it lets you know what type of content your fans find most interesting or useful. Based on this you can determine what works and what other similar content you can create that your audience might enjoy.
Now, if you use AdWords, GA also lets you see detailed reports for traffic driven by your ads, including campaigns, keywords and keyword positions, search queries, hour of the day when most people clicked your ads, and much more. These reports will not only show you the number of visits each campaign generated and how many pages each visitor viewed per visit, but also your total goal completions and the revenue generated from each. These two metrics are very important as they tell you how well your ads are performing.
If you look at the Keywords tab you’ll notice that it’s a bit poor. Plus, when you go to Organic there’s this annoying (not provided). A year ago this was filled with keywords people used to reach your site. But not anymore, not since Google went dark on keywords, allegedly to protect the privacy of its users.
Don’t despair as the Search Engine Optimization section can come in handy as it’s where you can find the search queries people used to get to your site. However, to get access to this data you’ll need to connect your site in Webmaster Tools to your Google Analytics account. Here’s how.
Now let’s use dimensions to filter some data.
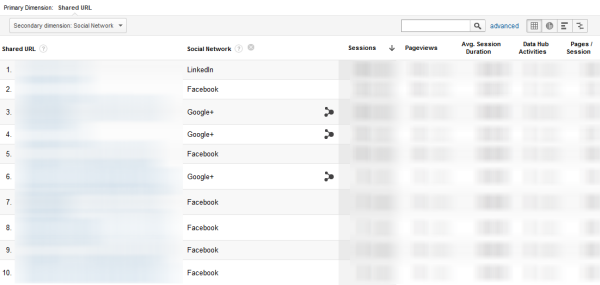
For example, you may want to see what you top landing pages are on each social network. Simply go toSocial -> Landing Pages and then select Social Network as a secondary dimension.
Google Analytics Landing Pages Social Network
This lets you see what type of content works best on each social network so you know what to focus on moving forward.
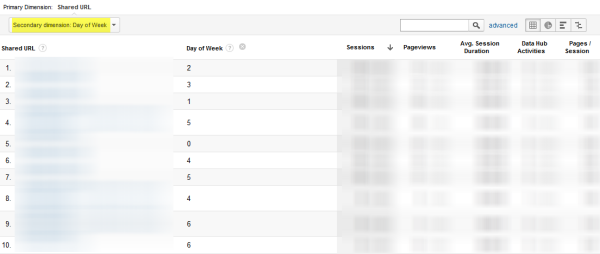
Or you could select Time -> Day of the week as a secondary dimension to see which day of the week your URL were most shared:
Analytics Shared URL Day
This can give you an idea of the best days to share content on social networks. So if you have something important to share, look at this data to see on which specific day it’s best to share it to reach more users.

3. Behaviour – What content do my visitors like most?


This is an extremely important area of GA and probably the one you’ll visit most often as it includes vital information on your most popular pages, how fast your site is loading as well as what people are searching for on your website.
Let’s take them one by one.
3.1. Site Content
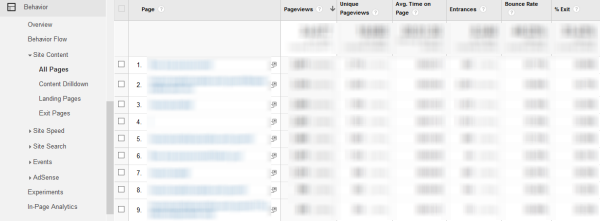
I’ll never get tired of saying this: Content is the heart of your website! So if you want to find out if yours gets read and which pages or blog posts are most engaging, go to Behaviour -> Site Content -> All Pages.
Google Analytics Site Content
Here’s how to interpret the most important metrics:
  • Pageviews/Unique Pageviews: These two metrics are different. While a Pageview is recorded each time a page is loaded (meaning that if a visitor is on a page and clicks refresh or goes to another page and then uses the back button to return, it counts as a second pageview) while a unique pageview refers to the number of times a unique visitor loaded the page.
  • Avg. Time on Page: This is an average measure of how long a visitor stayed on that page. If the average time on a page is a few seconds it means that visitors didn’t find what they were looking for. Now, if users spend more time it means that they found it interesting or useful.
  • Bounce Rate: This is the percentage of users who only visited one page in their session. Don’t read too much into a high number as it may mean two things: either they didn’t find what they were looking for (which isn’t good) or they found it quickly which means your site is awesome.
Now, if you have a big site with loads of pages organised in different categories you can go to Content Drilldown to see how these categories are performing. This section is particularly useful for sites with hundreds of pages such as online shops.
For example, say you have a sports equipment store and have different sections on your site such as: swimwear equipment, running equipment, golf equipment etc. You can go to Content Drilldown to see how the swimwear equipment category performed during a specific time period, like summer or winter, or how it performed this year compared to last year. This way you’ll know that if traffic drops in the winter for swimwear equipment, it’s because, well, how many people swim during winter?
The Site Content area also shows you the top Landing Pages on your site, meaning the pages most visitors land on as well as your top Exit Pages, which are the pages most visitors leave. Pay attention to the exit pages as these can provide clues as to where your visitors might be getting stuck.
To get more from this section, you could go to All Pages and then use Title (under Behaviour) as a secondary dimension. This will show you which pages have duplicate or missing titles.
3.2. Site Speed
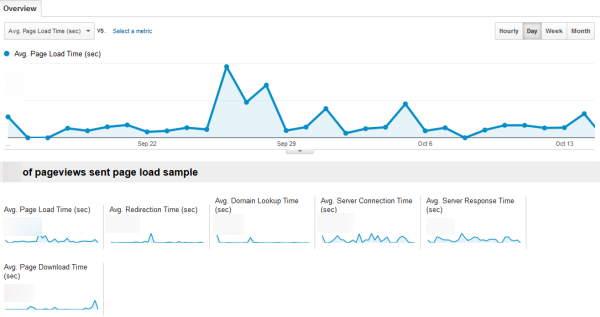
Be sure to check this report to ensure that your pages are loading fast because if they take too long to load, you visitors will get frustrated and leave.
Google Analytics Site Speed
Most web users wait six to ten seconds for a page to load before they exit, according to a Kissmetrics survey. Also, an Amazon study showed a 1% decrease in sales for every 0.1s decrease in response times. In addition, page speed is linked to better rankings and user engagement. So make sure you check this report to ensure that no visitor is abandoning your site because it takes too long to load.
What does this all mean? It means that it’s best to have an average server response time under 1 or 2 seconds. The average server response time refers to how fast your server responds to a request for a page from your site and starts sending data to the visitor. When it comes to your average page load time, this should preferably be under 10 seconds.
If you go to Speed Suggestions, Google will recommend some things you can do to improve your site speed so don’t skip those as they can have a big impact on your website’s performance.
3.3. Site Search
Check this section only if you have Google’s search tool installed on your website which allows people to search directly on your website. There aren’t many visitors who run a search directly on the site as many have already landed on a specific page after running a search on Google, but some do so it might be worth checking.
If you go to Search Terms you will see what people typed in the search box which gives you an idea of what they were searching for on your site. Looking at this data you might get some ideas on what your audience is looking for and maybe create some new content based on those search queries.
The other reports – Events, AdSense, Experiments and In-Page Analytics are a bit more advanced, but if you use AdSense or have programmed Events into your site’s code, this is where you’ll be able to monitor them.
Here’s a short description of what these can help you with:
  • Events – Add a code to your links and track events such as how many people downloaded a whitepaper that you’ve published. Here’s a guide to help you set up event tracking in Google Analytics.
  • AdSense - If you want to integrate your AdSense account with your Analytics account and see which pages or content on your site generate more ad clicks and revenue, this is where you should go.
  • Experiments – This tool lets you perform experiments with your web pages using different design variations to improve its performance.
  • In-Page Analytics – A pretty awesome tool, it shows pages on your website with Analytics data overlaid on top of the pages. Definitely worth checking out.

4. Conversions – How much is my site converting?


Conversions are broken down into two categories: goals and ecommerce.
To track goals, you’ll need to tell Google which actions to track and log as conversions, for example: buying a product, downloading a whitepaper, signing up for a webinar, filling out a contact form.
There are four different types of goals. Some may be pages on your site you want visitors to reach such as a thank you page after someone has registered for a webinar or placed an order. You can also set a goal for a length of time spent on your site, the number of pages per visit, or an event.
You can also set up a funnel, or a series of pages leading up to your goal page which would allow you to monitor users’ journey. This is very useful as you get to see at what point users abandon the conversion process. So rather than wondering what went wrong, you can see exactly where the user decided to abandon the action and figure out what you can do to make sure people convert in the future..
To learn how to set up goals and conversion funnels, watch this useful video:
E-commerce conversions are much more complicated to set up, and require inserting code on your website. You can find more information about ecommerce tracking in the Google Analytics help files.

5. Creating custom reports


Rather than digging into the information GA provides in its pre-defined sections, why not create your own custom reports and filter the data based on what you think is important?
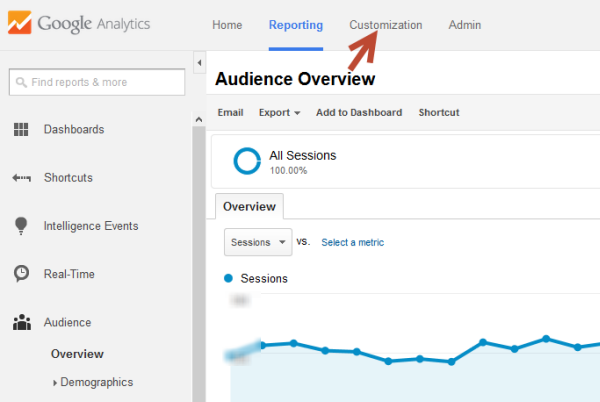
To create a new report, go to Customisation and then click on New Custom Report.
Google Analytics Custom Reports
Here is a step-by-step tutorial that explains how to create a custom report in GA.
If you don’t know what custom reports to create, check out these posts for some great ideas:
  • My top 5 most used custom reports in Google Analytics
  • 18 useful Google Analytics custom reports, segments and dashboards for SEO
Now that you know how to create your custom reports, there’s nothing stopping you from improving every bit of your website.

Wrapping up

If you made it this far, congrats!
While I tried to cover as much as possible, Google Analytics is huge so there’s much more to discover. But hopefully this guide will help you get started with a few of the neat parts of it which can help you improve your site.
You can also check out the following super-useful resources:
  • Did you know Google Analytics can do this?
  • Google Analytics resources for beginners to advanced users
  • The small business guide to Google Analytics
  • General resources: Google Analytics Help Centerofficial forum and official blog
Do you have anything to add? I’m sure I missed things, so please add your suggestions or questions in a comment below.
To view the original article Click Here