
Do you hear that?
Drip…drip…drip…
That’s the sound of your ideal potential customers leaving your website.
Every drop of water in the bucket represents a customer on your website. The bucket? That’s your conversion funnel.
Even a small leak can lead to significant losses over the long-term. And if you have big enough leaks, you might find your business quickly running dry.
The good news is that leaks can be fixed, all you need to do is call a plumber… err, conversion optimizer. Better yet, I can show you how to do it yourself.
How to Identify Where Leaks Are Occurring
Before you crack out the sealant, you need to find the worst leaks.
Depending on the size and shape of your bucket (business), it can take some time and expertise to diagnose leaks.
I’ll walk you through the basics and get you on the right track.
Step 1: Start Tracking Your Data
Data is always a prerequisite for any aspect of conversion rate optimization. For this particular job, you need an analytics tool that can track your audience’s behavior throughout your site.
The most popular analytics tools are:
- Google Analytics (Free)
- KISSmetrics
- MixPanel
If your business is on the smaller side, or even just starting out, you can get away with just using Google Analytics for now. The other two premium options make finding leaks a lot easier, so consider them if you have a significant amount of unoptimized traffic.
Step 2: Set-Up Your Sales Funnel
Do you know what your funnel looks like?
If not, now’s the time to figure it out.
Your funnel should separate all important steps and destinations between landing on your website and eventually converting to a customer. Here’s a good guide to help you understand and create a sales funnel.
Note that you can have multiple funnels.
For example, one might start with landing on a blog post, while another might start with landing on the home page. Start by identifying a few of your most important funnels, and then map or write them out. You can always repeat this entire process for other funnels down the line.
Here’s what a basic funnel might look like:
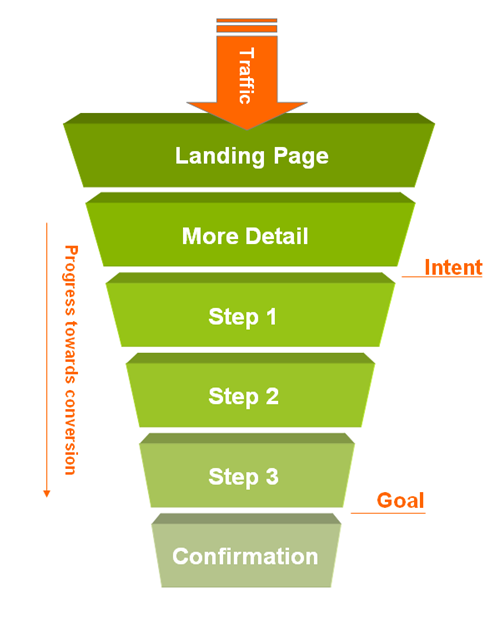
You can have as many or as few steps as needed. Just make sure your funnel(s) accurately describe the path a visitor can take.
Step 2a: Set Up Your Funnel(s) in Your Analytics Software
Depending on which software you’re using, this step will look a bit different.
KISSmetrics has created one of the best guides to setting up your funnel in Google Analytics. Essentially it boils down to setting your goal, and then also including URLs of other pages in your funnel.
If you went with KISSmetrics, there’s not too much that you have to do. Other than identifying your key events, it’s really easy to modify a funnel report. Here’s a sample report of a funnel:

Step 3: Visualize Your Funnel’s Conversions
Some people are great at looking at a sheet of data and spotting anything unusual… I’m not one of them.
At this point, you can certainly export a .csv of all the data in your funnel if you would like, or you can choose to use the built-in visualization features of your analytics. I’ll take option 2. How about you?
It’s the default type of report in MixPanel and KISSmetrics, but it’s also easy to do in Google Analytics.
To start, scroll down on your Google Analytics menu and expand the “Conversion” section. Select “Goals,” and then “Funnel Visualization”:

After you do that, you should get a nice pretty funnel like this:

Step 4: Spot the Leaks
Just about any step of any funnel can be optimized to convert better but blindly picking spots would be wasting your time.
Instead, it makes sense to identify any easy wins and fix those first, resulting in the biggest overall conversion gains for the least effort.
What should you look for?
The easiest wins are typically at the steps with the lowest conversion rates (to the next step).
Consider the following (very) basic funnel:
| Step of Funnel | Visitors | Conversion Rate |
| 1 – Homepage | 100 | 10% |
| 2 – Email signup | 10 | 60% |
| 3 – Visit product page | 6 | 33% |
| 4 – Checkout | 2 | 100% |
In order to improve the overall conversion rate (2%) by 50%, you would need to improve the conversion rate of any of the steps of the funnel by 50%.
It’s literally impossible to improve the last step, as it somehow converts 100% (will probably never happen in real life). But what about the other steps?
Improving the email signup on the homepage from 10 to 15 percent seems quite possible, but improving the conversion rate of the second step, from 60 to 90 percent would be extremely difficult.
In general, the lower the conversion rate at an individual step, the easier it is to improve, and the bigger the leak is.
How to Identify WHO is Leaking Out
So you’ve found the leak(s), but do you know how to patch them?
This is often the hardest part: identifying which of your visitors are leaking out.
To take the analogy further, the water in your bucket came from many sources: the rain, a tap, and water bottles. Well, your website’s traffic is also the same. It might come from social media, other blogs, search engines, or many more sources.
While each of these look like traffic, there can be small differences between them that make a huge impact in your conversion rate. They might speak a different language, use a different device, or have a different internet speed, among other things.
There’s really hundreds of possible causes for a leak, but it would be impractical to check them all. Instead, I’m going to walk you through the most common culprits.
Reminder: I’ll be using Google Analytics for examples, but all the same things can be viewed in premium options, often easier.
1. Start with Browser
Most sites are designed around one browser (i.e., Chrome, Safari, Firefox, etc.). The problem is that all of these browsers interpret code in their own way, and your site might not be fully compatible with all of them.
While good developers will check for this, it’s a very common issue if you go with cheap developers or a cheap theme. Additionally, if you’re fiddling around once in a while, which may be necessary, it’s possible for a small mistake to go unnoticed.
To check for this, use the left side menu to navigate to “Audience > Technology > Browser & OS.”
Start by adding a secondary dimension of “Browser Version.”
Then, add a segment for desktop users, mobile users, and tablet users to make your results fair.
Assuming you set up your goals correctly before, you should see a report that breaks down conversion rate by browser:

Look for any significant differences in conversion rate between browsers and between browser versions. In the report above, Internet Explorer 8 (an old version), converts almost 36% less than Internet Explorer 11!
The fix: Have your developer improve the compatibility wherever you see major differences. These small plugs can add up to big differences in the overall conversion rate. You can use BrowserShots to check hundreds of browser versions at once.
Keep in mind that you ideally want at least a few thousand users for each browser version to conclude anything meaningful.
2. Check Conversion Rate Across Devices
Have you ever gone to a site on your phone and gotten stuck in a pop-up that you couldn’t figure out how to close?
Pop-ups are just one way that a good desktop experience might not translate into a good mobile or tablet experience.
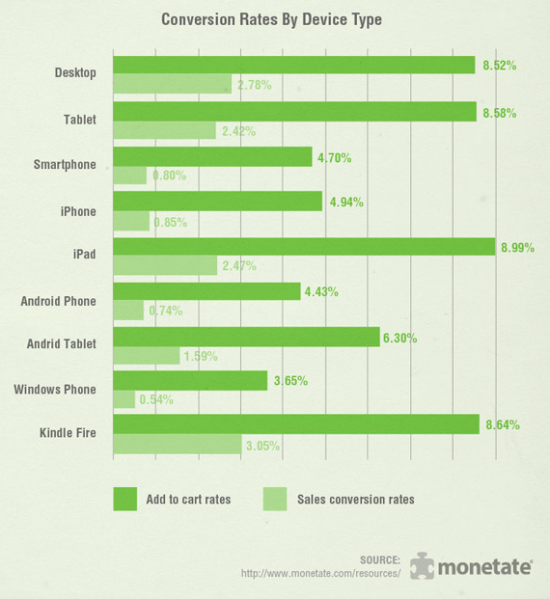
This infographic is based on fairly recent data about conversion rates across different devices. It shows that tablets should convert about the same as desktop users, but phone users only convert around 30% of that.
It’s time to check what your conversion breakdown is by device.
It might not be intuitive, but head over to “Audience > Mobile > Overview,” and you should see a simple report like this:

You can also select the “devices” menu option if you’d like to break it down further.
What you’re looking for is any abnormal discrepancy between device type. Yes, there will be some difference between mobile and non-mobile conversion rate, but if there’s a 10x or more difference, you likely have a display or interaction issue on mobile.
The fix: Navigate through your funnel on as many different devices as possible. See if selecting or inputting data is difficult due to the current design.
3. New Vs. Returning
A brand new visitor acts a lot differently than a returning visitor. While it would be useful to extend that further (e.g., 5th time returning vs. 1st time returning), there’s typically not enough data.
However, you can still examine this factor, and often find a conversion leak, by heading to “Audience > Behavior > New vs Returning.”
You’ll get a very simple report that looks like this:
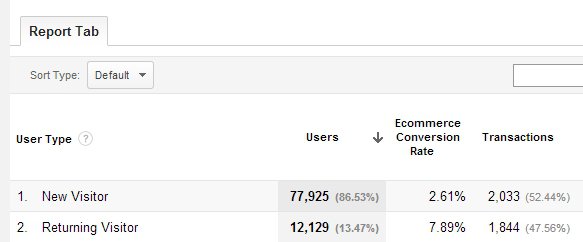
In general, if there is a huge difference between the two conversion rates, you have a major leak.
The fix: Depending on your specific goal, there are multiple possible solutions. For example, if you’re examining email opt-in rate, and new visitors sign up much less, you may need to increase the visibility of your opt-ins. Most of the time, the leak is caused by visitors not knowing how or where to convert.
4. By Landing Page
Ideally, you have the time and resources to make every landing page perfect the first time you create it. In real life, that doesn’t always happen, for many reasons.
What will end up happening over time, is that some pages will convert muchhigher than others.
Start by heading over to “Behavior > Site Content > Landing Pages” in your analytics.
You should then see your goal conversion rate beside each landing page:

The fix: Here’s where you need to channel your inner Sherlock Holmes. Why would one landing page convert worse than another? It usually comes down to the user having different expectations when they arrive at either page, or it could be due to the different layouts.
It’s worth polling some visitors and considering your user experience to deduce why exactly one page is converting worse.
5. By Source
When visitors come from a specific source, they have a specific mindset and expectation. The more you match that, the higher your conversion rates.
The easiest way to examine if you have any major leaks by source is to run a report. Go to “Acquisition > All Traffic > Source.”

There will be some differences in conversion of course. For example,Stumbleupon traffic won’t convert anywhere near as well as most other traffic no matter how well you optimize for it.
This report tells you two things. First, it tells you if any particular source is converting really well. If so, spend more time on that source in the future.
Secondly — and what we’re mainly concerned with here — are major differences in conversion between similar types of traffic.
If traffic from Pinterest is converting much worse than other traffic, it’s likely because your landing pages aren’t relevant enough. What I mean by this is that you drive traffic from Pinterest with images. If your landing page is all text, most visitors will leave, even if that may be a appropriate for visitors from search engines.
The fix: You can't optimize your pages for all traffic sources. Either optimize it for the most important sources, or create more than one version so you can send different traffic sources to different versions.
Conclusion
Every website has leaks, but the most successful ones only have small ones.
Use this guide to get started and plug your biggest leaks, and you should see some incredible improvements to your overall conversion rate.
After that, you can decide to dig deeper past these common leaks as you continue your conversion optimization plan.
To view the original article Click Here
No comments:
Post a Comment