Wednesday, 2 September 2015

How to Leverage Social Media for SEO: Link Building

breaking down the silos of SEO and Social Media Marketing with Link Building
I recently asked a room of experienced marketers how they thought social media marketing could assist their SEO efforts. The answers were more or less what I had expected to hear:
  • Social media helps foster relationships, which in turn helps build links and improves rankings.
  • Social media aids in public relations, as a distribution channel and a means of generating easy online buzz.
  • Social sharing provides a form of social proof, giving greater credibility and trustworthiness to your content.
  • Brands can rank for their social networking profiles and receive greater visibility within the SERP.
While these are all true, let’s focus on how link building on social platforms can help unite a brand’s social media marketing and SEO efforts.
At the most basic level, social networking sites provide an easy way to share and distribute your message. If the content is seen by the right people, it can lead to new backlinks.
In fact, there are measurable correlations between social shares and backlinks that demonstrate that social media can help with backlink acquisition. Let’s explore this integration across social platforms.

Link Building with Google+

Google+ has an excellent infrastructure for finding link opportunities and organizing those linking prospects for outreach; it even includes an integrated messaging system for actually getting in touch with these people.

Prospecting

There are lots of ways to find linking opportunities on Google+. For example, using Google search, you can find a journalist by publication with an advanced search operator such as site:plus.google.com inurl:about “contributor to” mashable.com
Alternatively, you can use the “find people” section on Google+ and search with the “find coworkers” function. In the “company name” field, insert the name of a publication.
Using Google+ for Link Prospecting

Organizing Link Building

You can use Google+ Circles to organize and segment outreach lists.
I typically have a Circle for journalists by publication, a Circle for prospects who wrote about similar subject matter, and a Circle for bloggers with whom I have had past successes building links.
After you have gotten a link from someone, you can move these individuals into a “Success” Circle.
Using Google+ Circles to Organize Linking Outreach

Reaching Out Within Google+

One of the great advantages of doing link building with Google+ is its versatile built-in outreach engine.
Once you have an outreach Circle, you can choose to share an update specifically with the individuals contained in that Circle.
If people in the Circle have circled you back, then you can also opt to send them an email notification with that update. Check the “Also send email from you to [Circle Name]” box, and they will receive the update in their inbox.
promoting links to google plus circles and sending them an email
You can also send a message to individuals or even initiate a Hangout with them (message or video). This is a great substitute for emailing.
making using of Google Hangouts for link building

Link Building with Twitter

Twitter is my social network of choice, and it also is a powerful channel for your link-building efforts.
Tools like klear (formally Twtrland) or Followerwonk can be leveraged to easily find subject matter influencers and their associated websites.
Using Followerwonk for link prospecting on Twitter
Once you know your prospects, you can organize them using Twitter Lists. You can easily import them using a tool like Electoral. Segment your lists and interact with the people periodically, building relationships with them over time.
If you are looking for a Twitter user’s email address, you can use a tool like All My Tweets to load everything they’ve ever tweeted on one page — then use Control +F in your browser to look for patterns that resemble email addresses like “at domain dot com.”
If you cannot find someone’s email address, Twitter Direct Messages are a decent substitute and can provide a more private option, as compared to just mentioning people with linking inquiries. Of course, they have to be following you before you’re able to send them a direct message.
You should also be doing some basic social listening on Twitter (and other social networks) using a tool like Social Searcher.
Keep a lookout for people who mention topics related to your website’s niche that you might be able to ask for a link. The old “I see you mentioned [topic], so you might like[link]” works quite well.

Link Building with YouTube

People love to link to video content, but, unfortunately, most companies depend on YouTube for their entire online video strategy.
The result of this mindset is that YouTube.com earns all the backlinks for your video content rather than your company’s website. Your company can mitigate this by self-hosting videos or using a service like Wistia, which allows you to control embedding so that people link to your website instead of to YouTube.
If self-hosting videos is not an option, and your company insists on an all-YouTube-or-nothing approach, you can still use that video content to build links through a standard link reclamation process:
Take a video that has been successful on YouTube, put the YouTube.com URL into a backlink checker like Majestic, Ahrefs, or Moz’s Open Site Explorer and get a list of websites linking to it.
You can reach out to these websites and ask them to link to your company website instead of the YouTube.com link.
Another approach is to access your company’s YouTube Analytics. “Traffic Sources” will show you any websites that embedded the video (but not necessarily linked to it). You can reach out to those websites and request a link to your company website.
Using YouTube for link reclamation

Link Building with Social Paid Search

Half the battle of link building is getting in front of the right eyes, and paid social ads can help!
For example, you can use Facebook ads and target people by their workplace. For our purposes, we’d target journalists (who may link to us), and the workplaces would be a list of publications like Wired, The New York Times, and Mashable.
You can use LinkedIn advertising to accomplish this, but those ads tend to be a little more expensive.
Using Facebook Ads for link building and targeting journalists

Conclusion

As you can see, there are many ways to perform link building using social media. It is one of the many ways to break down marketing silos and integrate your social media marketing and SEO.
Social networking has become one of the primary ways we communicate today, so those platforms become a logical medium for conducting link outreach. In addition, there are tools baked into social network sites to aid link prospecting, easy ways to get in front of influential journalists who may have otherwise ignored you, and even systems to help organize your outreach.
Social media and SEO are two peas in a pod, and building links is a great way to make use of their synergy today.

20 Cool Tools for Creating Infographics

creating infographics header image
Imagine if you could take 1,000 words a and help people digest that information in only a few seconds?

An infographic, put simply, is a creative way to take a “thousand words” and depict them using a picture. These days, readers are looking for quick access to brief information.

Website visitors love
 this unique form of presentation which is quickly gaining popularity, and in some cases, becoming the standard form of communication instead of page long, lengthy blog posts.

Infographics have emerged as one of the most popular forms of content marketing in contemporary digital media.

But why should you care about infographics?
  • We receive 5 times more information than in 1986 and are 80% more willing to read anything with colors. Infographics are great with colors.
  • 45% more users will click on a link if it features an infographic.
  • They help us get valuable inbound links - Streetcouch does a great job of explaining the importance of creating infographics and sharing them on social media in a 5-step process (as a link-building strategy).
Readers are not the only ones with time constraints and an inclination towards quick and easy ways to consume information.

What if you, the creator of an infographic, are also short on time and need a simpler, quicker way to create beautiful infographics in an instant?
Forget about Photoshop and other time-consuming image creation methods.

Let’s introduce you to a set of tools that will make creating infographics simpler than ever!


1. Easel.ly

Creating infographics with Easel.ly

This application will let you create an infographic in just a few clicks.
First, you get to pick a template from a long list of cards, then a search bar and drop down menu on the side will allow you to filter the template results.

For instance, you could search for a template that deals with geography (maps) or templates with a timeline format.

Once you’ve selected your template, you can add in more shapes, backgrounds, charts, objects and of course text to personalize the template and let it tell a story in your own way.

The basic version of this tool is offered for free.


2. Visualize.me

Creating infographics with Visualize.me

Visualize.me focuses on letting users create “infographic resumes”. However, the template designs are not limited to that purpose alone. Once you’ve signed in with your LinkedIn or email account, you can select from a range of beautiful themes, language maps, timelines, bubble charts, tree maps, pictograms, and other formats.

3. Visme.co

Creating infographics with Visme.co

Visme is another super cool tool that allows you to create interactive presentations, infographics, ad banners, animations, customer layouts, and more. It has an extensive library full of templates, shapes, icons, and objects to choose from.

It is a highly-recommended app by  Coursework Spot, a service that offers academic research. If you’re not up for a bunch of changes, edits, additions, or subtractions, you may simply edit the text and hit publish. You can also directly insert data values to change the charts and graphs.

Another plus point is that it’s “specially priced” for teachers and students.


4. PiktoChart

Creating infographics with Piktochart

Applications like these could kick graphic designers out of business since PiktoChart markets itself as the tool that let’s “non designers create beautiful infographics in as little as 10 minutes.” This may be a shocker – or maybe even a bit offensive – but it is true. Piktochart has over 400 fully customizable themes with retina-ready images, objects, graphs, and colors you can edit and adjust according to your preference.


5. Canva

Creating infographics with Canva

One of the most uniquely and brilliantly designed websites,Canva aims to train both designers and non-designers to come up with cool and creative stuff. Canva will start out with a brief tutorial to acquaint you with their program. Once you’re through with that, you can move on to creating your project whether it be a presentation, Facebook cover photo, business card, ad, poster, banner, or a retina-ready infographic.


6. Infogr.am

Creating infographics with Infogr.am

Infogram is all about making charts and infographics “the easy way”. So far over 2 million infographics have been created using the website and some have even been used by prestigious organizations including Euronews, University of Cambridge, and the Huffington Post.

Whether you are blogger, educationalist, brand ambassador, or an organization, you can make charts/infographics in three easy steps: pick a template, visualize the data, and publish.


7. Venngage


Creating infographics with Venngage

Venngage has everything you need to create free infographics and publish them on the spot. You can choose from hundreds of professional templates.

Infographics are not all you can make; reports, posters, promotions, and social media posts can also be created using Venngage, allowing you to tell your story “visually” with the help of charts, maps, icons, and visuals.


8. Dipity

Creating infographics with Dipity

With Dipity you can create digital timelines. If a timeline-based infographic is what you are after, you can use Dipity to do the job. Dipity aims to organize web content by date and time.


9. iCharts

Creating infographics with iCharts

iCharts is a cloud-based visual analytics platform that allows users to create quick and easy visualizations for complex business information, data sets, or extensive research work. You can access and update your data in real time whenever you like since it is cloud native.


10. Geo Commons

Creating infographics with Geo Commons

Perhaps, you’re more interested in presenting maps instead of timelines. Geo Commons is perfect for geography-based infographics that must include a map of your choice.

Create feature-rich maps and share what you know!


11. Google Charts

Creating infographics with Google Charts

Why not simply use Google charts? This is probably an application you are already familiar with and definitely one that requires little training or experience to learn. Google Charts is a free solution with all kinds of charts, maps, bars, and statistical goodies to choose from. Google’s gallery is rich with variety.


12. InfoActive

Creating infographics with InfoActive

Infoactive is a simple and flexible platform that allows you to create interactive infographics and other “data driven” stories. InfoActive lets you connect your data to the application and let automation do the rest for you.


13. Photo Infographic Gen Lite

Creating infographics with Photo Infographic Gen Lite

If your infographic is based on the number, ways, or timing you take your photos, you can use this Android application to sum it up for you. This is a very specific program with a very specific purpose, but if you’re a photographer looking forward to fulfilling that purpose, it will suit your needs.


14. Get About

Creating infographics with Get About

Another application designed to cater to a specific purpose, Get About lets you create infographics that determine your social media activity. For instance, Get About will let you track your Twitter terms, hashtags, and mentions. Also you can monitor your social activity with infographics that chart out how you connect and share with your network.


15. Creately

Creating infographics with Creately

Creately is not only a diagramming tool, but also a tool that works for teams requiring real time collaboration. Creately will let you create style smart shapes, diagrams, connectors, and more to gather information in one compact space.


16. PhotoStats

Creating infographics with PhotoStats

This is an iPhone application dedicated to generating infographics on how, when and where you take photos. Similar to Photographic Gen Lite for Android, the application will reveal your photography habits in just a few clicks, and if you like, make it available to your friends.


17. Charts Bin

Creating infographics with Charts Bin

Charts Bin is a free online solution that allows you to create interactive maps. After a sign-up, create a map of your choice by inserting values or zooming in. If you like you can copy and paste the HTML code to your blog without having to go through a bunch of tricky steps to display it on your website.


18. Gliffy

Creating infographics with Gliffy

Gliffy will transform your ideas into shapes by providing you with a variety of flow charts, UML diagrams, wireframes, network diagrams, org charts, and sitemaps. Create digital visualizations by dragging and dropping shapes/lines/objects from the library and transforming words into graphs.


19. Wordle

Creating infographics with Wordle

Sometimes word clouds are all you need to explain a concept in just a few words. Wordle will let you create unique and interactive word clouds in a variety of fonts, layouts, color schemes and more.


20. Smile Widgets

Creating infographics with Smile Widgets

Smile Widgets is an extremely simple website that allows users to create “free, open source data visualizations and web widgets”. The software will let you create exhibits, timelines, time-plots, and runways of your choice.

To view the original article Click Here

Tuesday, 1 September 2015

Are You Targeting the Right Audience on Social Media?

“Hey, pay attention to us! No…wait, you’re not buying our product. Um…how about YOU?”
Does this confusion remind you a bit of seeking out your audience on social? It’s tricky. Location, gender, favorite network, hottest hashtag, other hobbies, following your competitors — what’s the magic formula for your ideal fan?

Here are five, must-use analyses that will get you moving in the right direction quickly.
Well, you know what all we Data Geeks from Dataville are going to say: Bust out the analysis! If you’ve been doing any social media marketing you have data to work with and can sort through it for audience-defining gems of all kinds.

Twitter Profile Keyword Analysis

Why: There are already people following you. What are they into? They’ll let you know with their Twitter bios. You get demographic data like hometown, career (#techpreneur), hobbies, alma mater, gender, values (#Belieber), and more.
Your job is to look for patterns. And, whittle your findings down to a list of words that appear most often in people who take the actions you seek: click through to your website, download your content, retweet your posts, mention you in their posts, and (ftw!) buy your product.
How To: You can download information about your followers from Twitter into Excel and find sort, organize, and tally up words. Create a list of the most common words in your existing followers’ bios. Then, see if you can connect certain words with people who engage more, like those most likely to reply, retweet or mention you.
This chart from the Simply Measured Twitter Audience Analysis shows the most common keywords in Twitter bios of followers for a brand.

Competitors’ Followers’ Keywords

Why: You want people to buy your product, not your competitors’.
Ideally, you’ll discover a segment you didn’t know you should be targeting. For example, maybe you’re a yoga studio owner and you find that a studio near you offers acupuncture and a lot of their followers are responding to deals they’re posting, or they list “acupuncture” in their bio.
Maybe you can offer some alternative medical treatments in your space, as well, or team up with a local practitioner as a co-marketer.
How To: The key here is to take an organized approach to each competitor’s followers. Look at their most engaged and active followers to start. How do their bios keywords, attitude and interests compare to yours?
Look, especially, for variations on the theme, such as an age group or geographic location you could target with special promotions or paid ads. Try to do this analysis at least once a month so you’re keeping an eye on the scene and what’s changed.
This chart comparing audience size over time for eight different brands is from the Simply Measured Twitter Competitive Analysis.

Your Most Active Followers

Why: Some people decided to follow your brand then took a really long nap…never to appear on Twitter again. Don’t despair!
You can use the data provided by Twitter to find out which of your followers is wide awake and actively engaged with your brand. These people are way more likely to enjoy any promotions you send out, share you content, and grow your following.
This Audience Distribution chart tells you what percent of your audience is most actively engaged on Twitter.
How To: Sort through your follower data by “Date of Last Tweet.” Study these followers’ other qualities and look for similarities – hashtags they most often use, when they’re most active, what time zones they are in, if they’re saying positive or negative things about your brand, or whatever else you would like to know.
Also, sort these folks by the size of their audience and pay extra attention to those with the biggest following. These are your most high-impact fans.

Who Is Mentioning You?

Why: Keyword analysis of people’s interests helps you find unexpected connections between your brand and other hobbies or interests. But, what about people who are straight up talking about YOU?
Scour Twitter, Facebook, and Instagram for mentions of your brand and, again, pay attention to these folks – social habits, demographics, friend groups you could reach out to, and more.
How To: Gather up mention data from Twitter, Facebook, and Instagram. Organize it and dig through it in Excel. You can do many different analyses. Look for any of the following:
  • Positive or negative sentiment
  • Other companies mentioned
  • Most common product mentions
  • Hashtags associated with your brand
  • Celebrity or influencer mentions
  • Cross-network sharing
For example, when looking at brand followers on Twitter, we discovered a wacky and wonderful connection between Starbucks and H&M fans. Sure, it makes sense that skinny latte lovers also love skinny jeans, but it’s reassuring to see data confirm the cross-over.
Our “1 Million Twitter Users” study showed that 16% of H&M’s followers also follow Starbucks (and vice versa). Less surprisingly, 26% of Burberry’s followers also follow Louis Vuitton (and vice versa).

Define Your Social Personas

Why: Any time you collect information about your audience, it can help you define, or redefine, your customer personas. When your marketing moves at the speed of social, you may be catching fire with a new group and only regular check-ins will keep you aware of that.
How To: For every marketing persona, try to fill in the following qualities, depending on what matters to your brand and product sales: age range, job, income range, interests, pain point you address, location, relationship status, and education.
Then, take that information and list out this person’s goals and challenges, and values and fears. Finally, create a marketing message for him or her and a succinct elevator pitch.
Keep all of this information handy for your social team, and possibly your entire marketing team. Having everyone on board with who you’re trying to target and what you’re trying to tell them multiplies your marketing impact.
Audience - Personas Graph

Audience Analysis for All!

What work have you done in the past to define your audience? Any nuggets of wisdom you would like to share? A lot depends on the data you can get from each network, but the real key is checking in regularly so you catch opportunities as they come.
To view the original article Click Here

New Study Reveals the Lifetime Value of a Blog Post

New Study Reveals the Lifetime Value of a Blog Post
As the most pervasive and arguably most important form of mass communication in the world, blogging is continually at the top of the content marketing conversation. However, despite blogging’s popularity, there hasn’t been an independent study to uncover the power and lifetime value of a blog post—until now.

Study: The Lifetime Value of a Blog Post

IZEA commissioned a new study titled “Lifetime Value of a Blog Post” to uncover the full value of blog content, giving marketers actionable data to contrast against other mediums they invest in.
Carried out by Halverson Group, the study revealed that the lifespan of a post is nearly 24 times the currently accepted measurement of 30 days (e.g. unique monthly visitors), showing that traditional measurement practices are not only imprecise, but significantly under-valuing the performance of a blog post.
The study found that only after two years will a blog post obtain 99 percent of its impressions. Only then, or by calculating for that timeframe, can true value be determined. More on that in a bit, but let’s talk about how we got our results first.
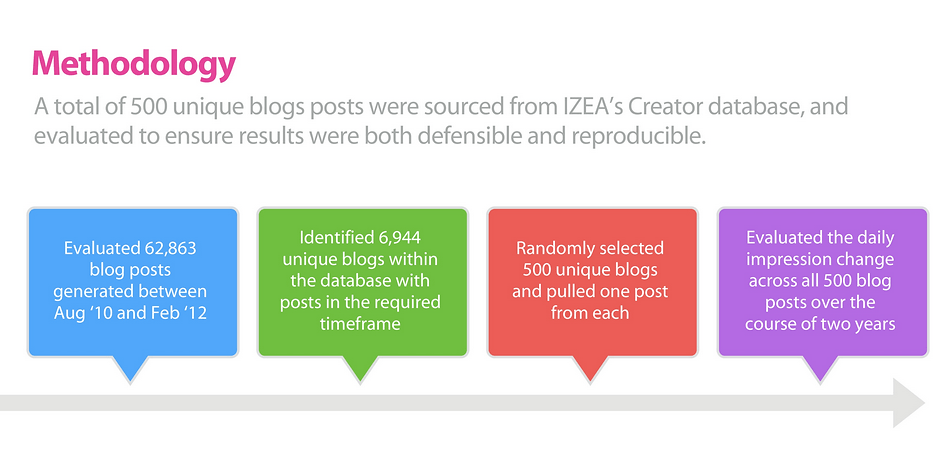
As part of the study, The Halverson Group evaluated 62,863 blog posts generated between August 2010 and February 2012. The team then randomly selected a quantitative sample of 500 unique blog posts, sourced from IZEA’s Creator database to ensure the results were both defensible and reproducible.
lifetime value of a blog post study methodology

The Three Life Cycles of a Blog Post

In addition to a blog’s lifespan, the study revealed that a blog post goes through three distinct “life phases,” further contradicting the historical use of a 30-day measurement period.

A Blog’s Post’s Lifespan

The study found that by day 700, a blog post will receive 99 percent of its total impressions. A 700 day lifespan indicates that blog posts are an annuity that provide value over a significant timeframe. This is an important data point for both blog owners who are looking to monetize their blog content and marketers who are looking to maximize return on their marketing spend.

A Blog’s Post’s Life Cycle

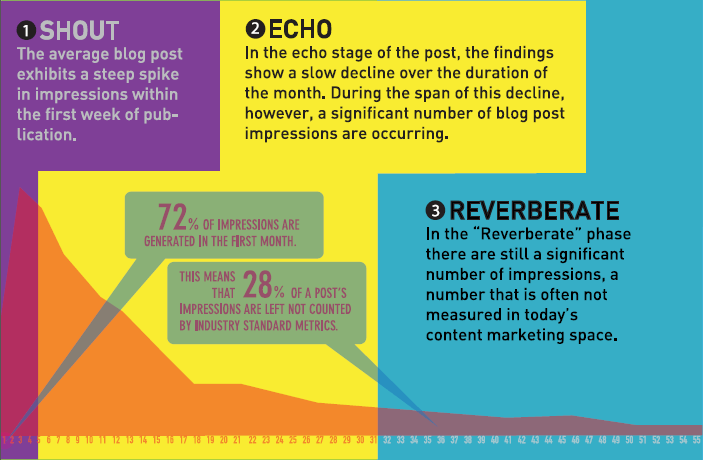
The study determined three distinct life phases a blog post cycles through, which are categorized as “Shout,” “Echo,” and “Reverberate.”
  • Shout: The “Shout” phase yields an initial steep spike in impressions that occurs within the first week to ten days, when 50 percent of a blog post impressions are generated.
  • Echo: The “Echo” phase begins shortly thereafter and lasts until day 30, when 72 percent of blog post impressions are realized.
  • Reverberate: The third, and likely least studied, phase in a blog post’s life cycle is the “Reverberate” phase. This phase makes up the 28 percent of remaining impressions and lasts from day 30-700. The Reverberate Phase is important for both content creators and marketers, as that is where the long tail value occurs. It is also the phase that most blog post impression metrics fail to take into account and quantify.
blog post lifecycle
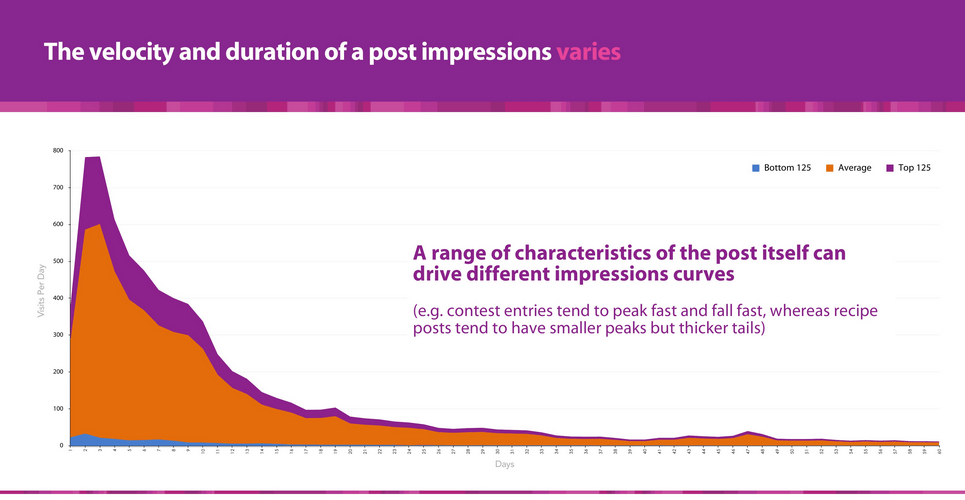
The study also confirms what many marketers already knew: that impressions vary depending on what the post is about. While some blog posts, like sweepstakes, see a spike in engagement over the first month, blog posts on topics such as recipes and thought-leadership deliver impressions over an extended period of time.
blog post impressions data

Calculating Lifetime Blog Post Impressions

For the everyday marketer or the rank and file blogger, the study produced a research-based metric that can be used to calculate the true lifetime impression delivery of a blog post.
To calculate the lifetime value of a blog post, multiply the posts’ monthly page views by 1.4x.
With a life-span nearing two years, blog content, and content marketing programs that leverage blogs have an evergreen value affect—especially when compared to volume-based media, such as display or search advertising, which stop delivering value as soon as the campaign investment ends.
To view the original article Click Here