

Today’s marketers are lucky. Why? The amount of data and tools to help interpret that data present an opportunity to be far more effective than in the past. However, marketers may not be using one of the most well-known tools in the most effective way.
We’re talking about Google Analytics. Unfortunately, it can be incredibly easy to merely focus attention on the vanity metrics within the platform. By vanity metrics, I mean sessions, users, pageviews, and other metrics that sound important. Of course it sounds great to have one millions sessions, but that metric doesn’t provide me with any actionable data. In fact, vanity metrics don’t provide much, if any, value.
Instead, marketers need to focus on the actionable metrics that will help improve and optimize performance. After all, Google Analytics should be viewed as an optimization tool. Marketers can use Google Analytics to create actionable plans to optimize a website. Actionable metrics help marketers create plans to improve a website in terms of creating new content, updating a site structure, or many other aspects of a website.
Below we’ll cover three ways that marketers can use Google Analytics to gather valuable insights and create an actionable plan based on those insights.
#1 – Find Your Best Performing Pages by Conversions
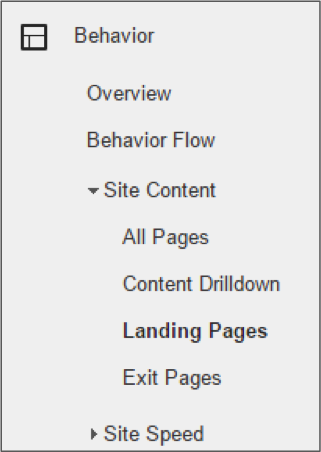
One of the first actionable reports you should analyze is page performance in terms of number of conversions. You can run the report for any channel to identify the best converting pages by source to get better insights. Being the SEO Analyst I am, I tend to focus on organic traffic. A report I recommend running is one that analyzes individual page performance during a certain date range compared monthly or yearly for organic sessions.
Analyzing the individual page performance in with the organic segment enabled can give insight if your site is increasing in authority for all pages or just a couple pages on a website. Once I have the report in the correct date range and filtered by the organic segment, I can see what pages are contributing to conversions. By comparing the date ranges, you can generally see changes in which you should identify any negatively performing pages.
After analyzing what pages are contributing to a loss of conversions an action plan should be created to fix the issues that may be causing the decrease. If it is only one page that is contributing to a large loss of conversions then a quick assessment can be made at the page level. If most pages are decreasing in performance then you might have some more technical SEO issues.
Pro Tip: Add annotations to Google Analytics for algorithm updates to match up any increases or decreases from organic performance quickly. A sudden change in organic sessions may be related to an algorithm change, among other situations too.
#2 – Mobile is Different Than Desktop
Making your website mobile friendly has been a topic covered in great detail by many blogs. With how important mobile is now, marketers should be looking at mobile data to make actionable steps to optimize the experience for their audience.
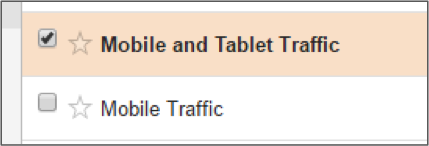
Instead of looking at how many users are coming to a website via mobile, we should look how mobile users interact with the site. A great report to run is one that uncovers the engagement metrics of the mobile users. There are a lot of engagement metrics to focus on like time on page and average pages per visit, but I like to keep it simple with the bounce rate on mobile devices.
Once again, you can view the number of conversions via mobile as that is always a good metric to track. Viewing the mobile bounce rate by itself doesn’t provide too much context. Of course, you can view the mobile pages that contain the highest bounce rate and analyze each page to see what you should do to lower the bounce rate. Or, you can compare the mobile bounce rate with the desktop bounce rate of a particular page. This comparison will help you understand how different the mobile experience may be for users and what needs to do done to make the experience better for either the mobile or desktop version.
Mobile is too important to just look at the number of sessions. Instead, focus on the metrics within the mobile data to build a tailored experience that your users are looking for. Just because your website is responsive doesn’t mean you shouldn’t focus on the data. You could be missing a large opportunity by not looking closer into the mobile data.
Pro Tip: Use the mobile page performance as a means of getting buy-in to test different types of content for mobile users. Showing the difference between mobile data and desktop will help create ideas on how to frame and show content to each user.
#3 – Get Your Own Site Search Data
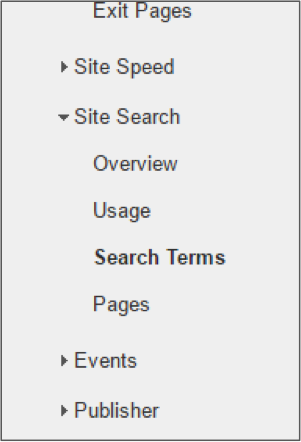
One often overlooked report in Google Analytics is the site search report under Behavior section. To access this report, you will need to setup the functionality first. Once setup, Google Analytics will track the search terms that people use on a website’s internal search tool. The site search report is awesome, because it will show you exactly how many times the site search tool was used, what terms people search for, and the page they search on. All three metrics within the site search report are important, but I tend to focus on the search terms report.
The search terms report will provide a list of keywords that people used on your website. There are many ways you can utilize this information, but one way is to create additional content on the most searched terms. Adding more content based off of what people are searching for will provide your audience with the content they want. Besides creating more amazing content for your audience, you may discover that people aren’t finding the right page easily enough. Instead, people might be searching for a particular page that would benefit them if included in the navigational structure.
Pro Tip: Use the site terms report to help structure a website for your audience. It may make sense to add or remove pages from a navigational menu if there are commonalities to the search terms.
Bringing it all together
As we discovered in this post, there are multiple other ways to track actionable metrics within Google Analytics. As a marketer, it makes me happy that I can develop a strategy to improve a website with the help of analytical data. At the same time, we have to be careful not to get caught up in only focusing on the vanity metrics as the main KPIs.
Understanding analytics can be hard and it takes a skilled marketer to use the data to make informed decisions. The good news is that TopRank Marketing can help you understand your data more and make the informed decisions to optimize the experience for your target audience. Do you need help with setting up and understanding analytics?
Understanding analytics can be hard and it takes a skilled marketer to use the data to make informed decisions. The good news is that TopRank Marketing can help you understand your data more and make the informed decisions to optimize the experience for your target audience. Do you need help with setting up and understanding analytics?
Header image via Shutterstock
To view the original article Click Here
No comments:
Post a Comment